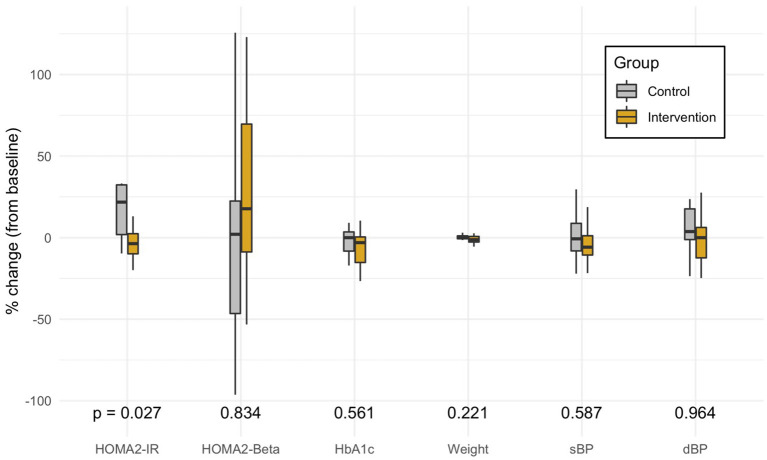
Figure 3.
Distribution of the percent change in each primary and secondary outcome variable from adjusted multivariate models. The box marks the median and first and third quartiles of the distribution; the whiskers extend up to 1.5 x IQR. P-values are from the multivariate model controlling for race, years of type 2 diabetes, stage of change, food access, and Medicaid status. HOMA, Homeostatic Model Assessment; IR, Insulin Resistance; Beta, estimate of pancreatic beta cell function; EVS, Exercise Vital Signs (minutes of exercise per week); HbA1c, Glycated Hemoglobin; sBP, Systolic Blood Pressure; dBP, Diastolic Blood Pressure.

