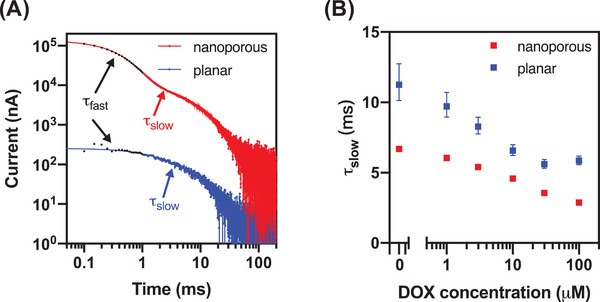
Figure 6.

A) Chronoamperograms of planar (blue) and nanoporous (red) electrode sensors with an electrode size of 500 × 500 µm2 in the absence of DOX (log scale, negative values not shown). B) The decay time (τ slow) of both electrodes at various DOX concentrations. Error bars represent the confidence intervals of the curve fitting.
