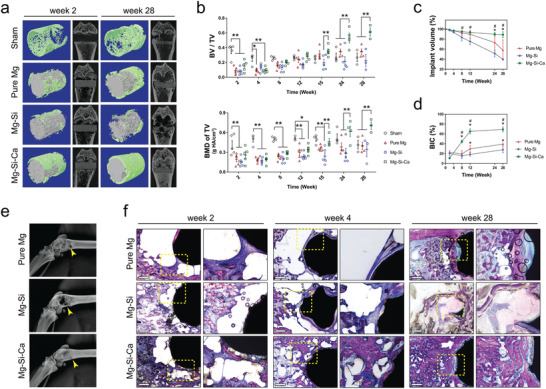
Figure 2.

The degradation of the implants and osseointegration. a) Representative micro‐CT images and 3D reconstruction of the implant (gray in color) and bone around the implant (green in color) at week 2 and week 28 postoperation. b) Micro‐CT measurements of BV/TV and BMD of TV during the 28‐week implantation period. n = 5, *p < 0.05 and **p < 0.01 by two‐way ANOVA with Tukey's post hoc test. c,d) Micro‐CT measurements showing the change in c) implant volume and d) bone–implant contact (BIC) during the 28‐week implantation period. n = 5, * or # represent p < 0.05 compared with pure Mg or Mg–Si group, respectively, by two‐way ANOVA with Tukey's post hoc test. e) Representative radiographs of femur with the implants at week 28 postoperation. f) Representative Giemsa staining showing osseointegration and new bone formation around the implants at week 2, 4, and 28 postoperation (scale bar = 500 µm).
