Figure 3.

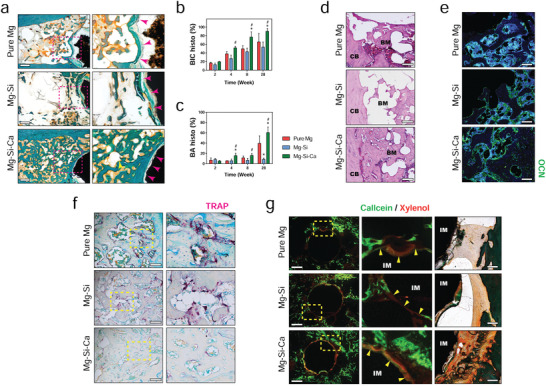
New bone formation triggered by the implants. a) Representative Goldner's trichrome staining showing new bone formation around the implants at week 28 postoperation (scale bar = 500 µm). b,c) Histological measurement of BIC b) and bone area (BA) surrounding the implants c) at week 2, 4, 8, and 28 postoperation. n = 3, * or # represent p < 0.05 compared with pure Mg or Mg–Si group, respectively, by two‐way ANOVA with Tukey's post hoc test. d) Representative H&E staining showing new bone formation around the implants at week 28 postoperation (scale bar = 200 µm). CB: cortical bone; BM: bone marrow. e) Representative immunofluorescent staining showing the expression of OCN around the implant at week 28 postoperation (scale bar = 100 µm). f) Representative TRAP staining showing osteoclastic activity around the implant at week 28 postoperation (scale bar = 200 µm). g) Representative images of calcein/xylenol labeling (Left, scale bar = 500 µm) with correspond Goldner's trichrome staining images (right, scale bar = 100 µm) showing bone regeneration around the implants at week 8 postoperation. IM: implant; BM: bone marrow.
