Figure 5.

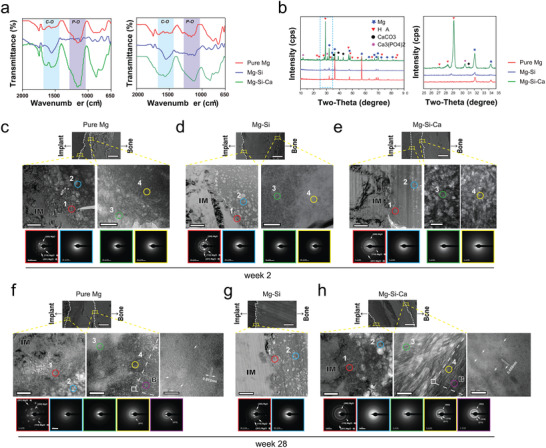
Changes in the bone–implant interface after implantation a) FTIR spectra of the degradation products on implants at week 8 and week 24 after implantation. b) X‐ray diffraction patterns of the implants retrieved from the femora 12 weeks after implantation. c–h) Representative TEM images showing the nanostructure of key regions of the bone–implant interface at week 2 c–e) and week 28 f–h) after implantation (scale bar = 200 nm). SEM images in the upper line indicate the location of key regions at the interface (scale bar = 30 µm), dotted line refers to the margin of implant, bone and degradation products. Corresponding SAED patterns of different layers of degradation products are shown in the lower line. IM: implant; B: bone. Nanostructure of the interface adjacent to integrated bone is shown at high magnification (scale bar = 10 nm).
