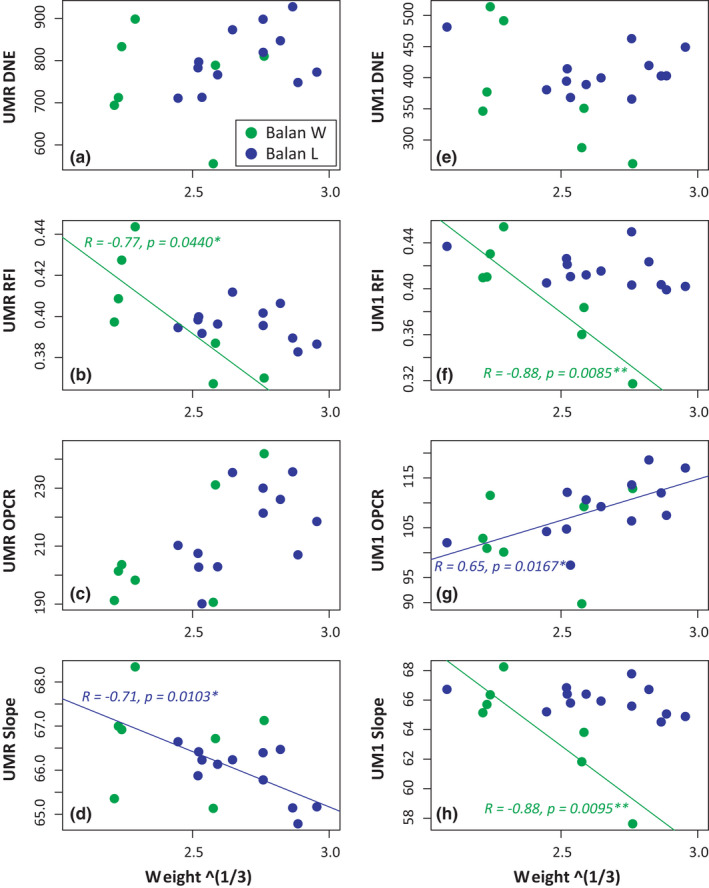
FIGURE 6.

Variation of molar topographic parameters with weight (cubic root) for the upper molar row (a–d) and of the first upper molar (e–h) in the two Balan groups (Balan W and Balan L). (a, e) tooth curvature (DNE, Dirichlet Normal Energy). (b, f): tooth relief (RFI, Relief Index). (c, g) tooth complexity (OPCR, Orientation Patch Count Rotated). (d, h) tooth slope. Significant associations are represented with regression lines (green, Balan W; blue, Balan L) [Colour figure can be viewed at wileyonlinelibrary.com]
