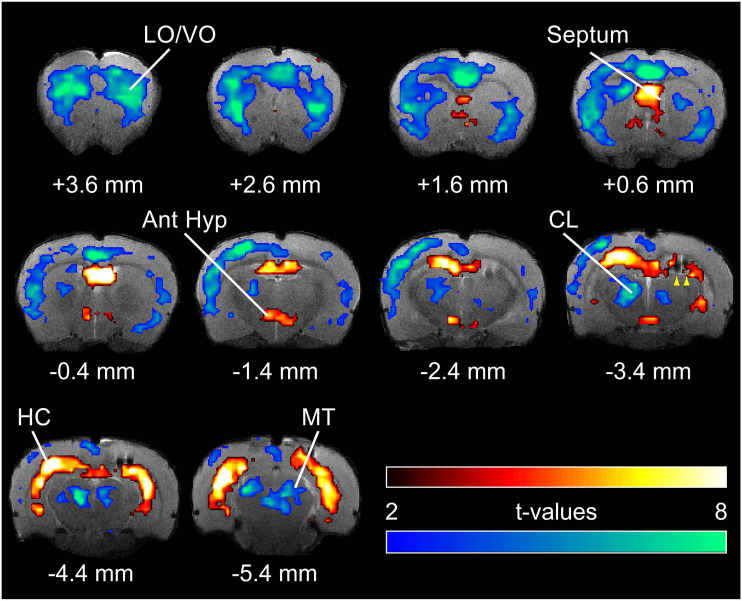
Figure 2.
Hippocampal, cortical, and subcortical blood oxygen-level–dependent (BOLD) fMRI changes during focal limbic seizures in a rat model. T-map of ictal changes during focal seizures (vs 30 s pre-seizure baseline) reveals a complicated network of changes. Widespread cortical decreases are accompanied by mixed subcortical increases and decreases. Increases are seen in known areas of seizure propagation such as the hippocampus (HC) and lateral septum as well as in sleep-promoting regions such as the anterior hypothalamus (Ant Hyp). Decreases are seen in the cortex, most prominently in lateral and ventral orbital frontal cortex (LO/VO) and in medial regions including cingulate and retrosplenial cortex. Decreases are also seen in arousal-promoting regions such as the thalamic intralaminar nuclei including centrolateral nucleus (CL), as well as in the midbrain tegmentum (MT). The arrowheads at AP −3.4 mm signify the hippocampal electrode artifact. Warm colors represent fMRI increases, and cool colors, decreases, superimposed on coronal anatomical images from the template animal. AP coordinates in millimeters are relative to bregma. 10 animals, with FDR corrected threshold P < .05. Reproduced with permission from Motelow et al. 19

