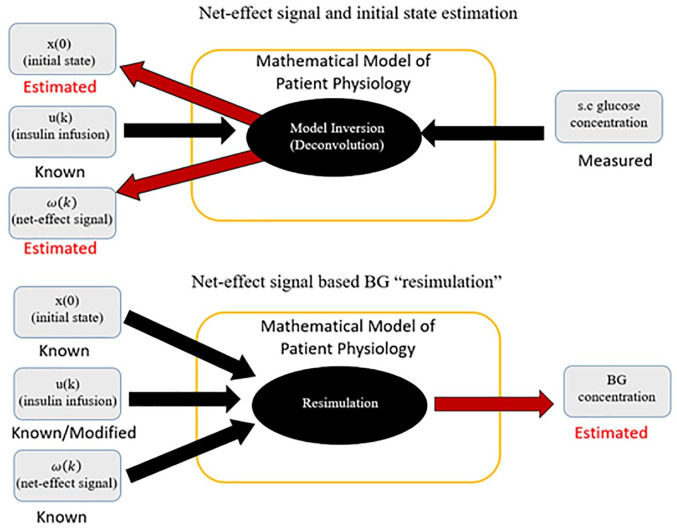
Figure 1.
A schematic diagram of the simulation procedure. In the top diagram, a visual representation of the signal calculation as described in Patek et al 9 is shown. Below, the resimulation procedure, in which the signal is used to “replay” the data to estimate BG traces with modified insulin is demonstrated.

