Figure 4.

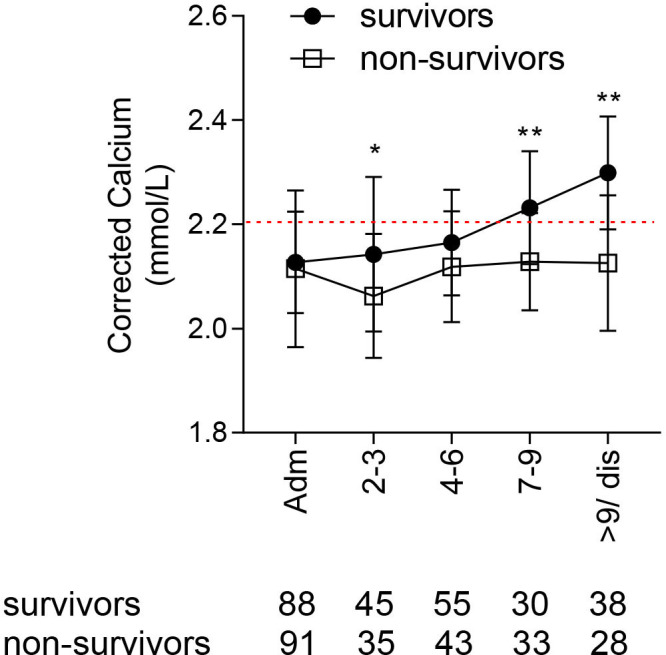
Corrected calcium levels during admission in survivors and non-survivors of COVID-19, hypocalcaemic at presentation. Calcium levels compared at each time point. Plots show median and IQR. *P<0.05; **p<0.01.

Corrected calcium levels during admission in survivors and non-survivors of COVID-19, hypocalcaemic at presentation. Calcium levels compared at each time point. Plots show median and IQR. *P<0.05; **p<0.01.