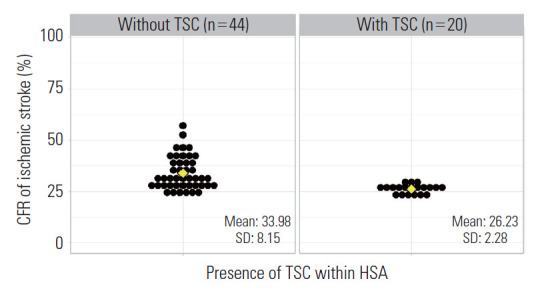
Figure. 2.

Difference in the average case fatality rate (CFR) of acute ischemic stroke between hospital service areas (HSAs) with and without thrombectomy-capable stroke centers (TSCs). Each black dot represents a HSA. The yellow diamond indicates the average CFR of each group. SD, standard deviation.
