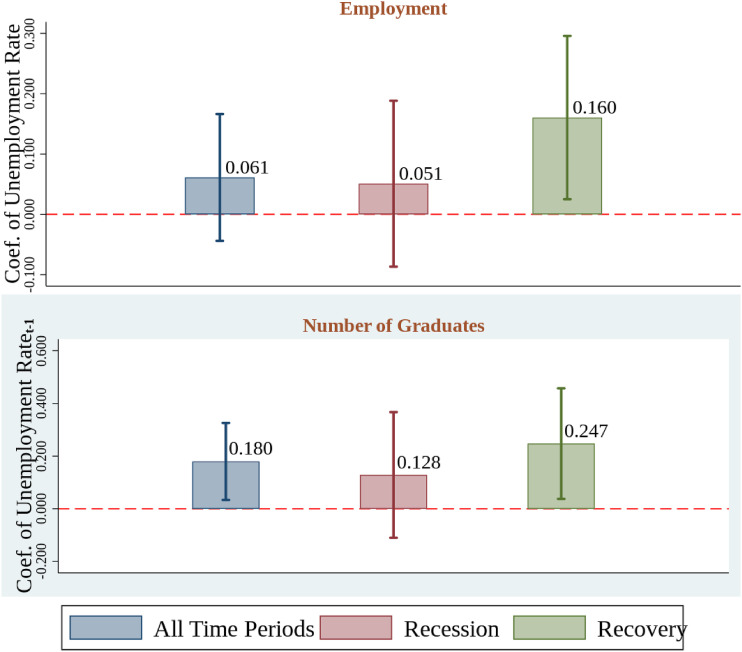
Appendix Figure A.
Share in Health Care Employment and Graduates vs. Unemployment Rate. Source: QCEW 2005–2017, IPEDS 2005–2017, and BLS LAUS (2005–2017). Notes: Figure shows coefficients and confidence intervals of the unemployment rate. For employment, unemployment rate is at time t. For number of graduates, unemployment rate is at time t-1. Regressions control for state and year-fixed effects. Regressions are weighted by population counts. Economic condition controls include state median household income, poverty rate, and working age population. Recession refers to 2007–2009. Recovery refers to 2010–2017.95% confidence intervals are obtained from heteroskedasticity robust standard errors clustered at the state level. Health care employment from QCEW refers to county establishments in NAICS 3-digit code 621, 622, and 623.

