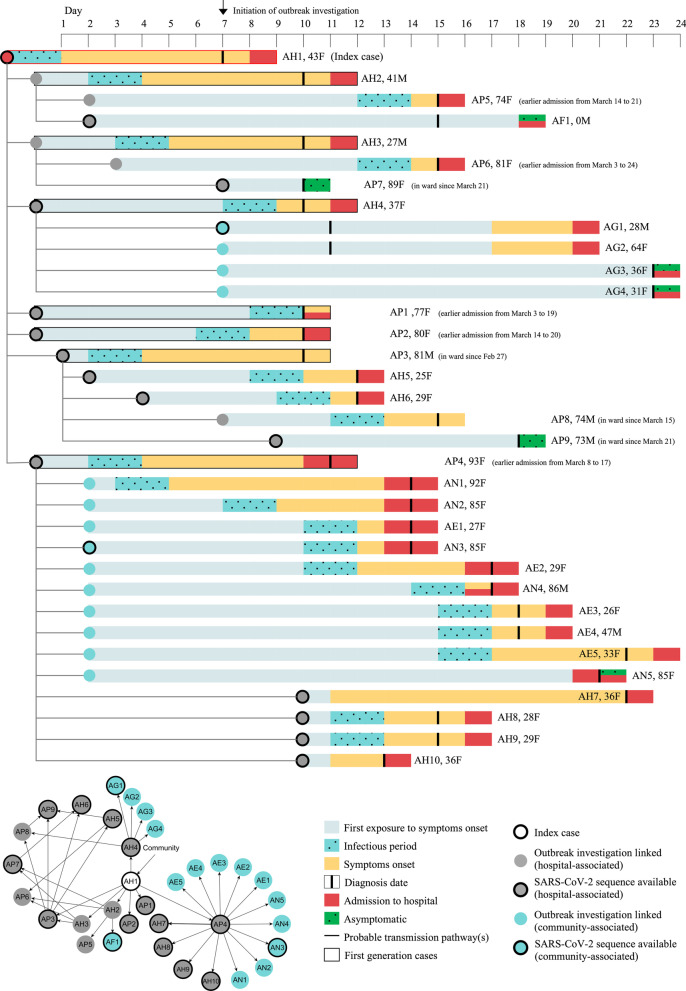
Fig. 2.
Timeline of events based on first exposure to a COVID-19 case, incubation period, diagnosis, and admission to the hospital from 15 March to 9 April 2020. Data of 34 cases are presented here. Top panel: Each row represents a case, and the rows are connected by lines to demonstrate the likely transmission of disease between case and contact. Each individual (case) is labeled based on transmission location (AH healthcare worker; AP- hospital patient; AF and AG- household members; AN- nursing home older adults; AE- nursing home employees) and number, age (years), and sex (F = female; M = male). AF1 was a one-month-old infant. AP3, AP7, AP8, and AP9 were patient-cases who were tested positive for SARS-CoV-2. Deaths occurred among AP1, AP3, AP4, AP7, AN4. The bottom left panel demonstrates multiple encounters between the cases and contacts

