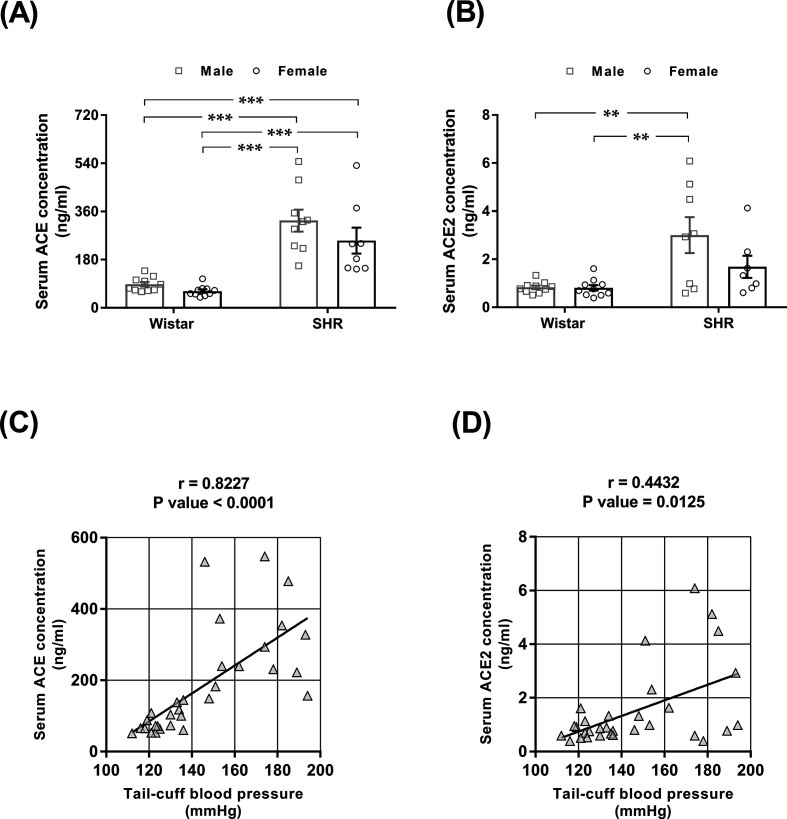
Figure 3. Serum ACE and ACE2 concentrations and their correlation with blood pressure in male and female normotensive (Wistar) and hypertensive (SHR) rats.
Serum (A) ACE and (B) ACE2 concentrations were determined by ELISA. The values represent individual measurements and the means ± SEMs. **P<0.01 and ***P<0.001. Correlations between the serum (C) ACE and (D) ACE2 concentrations and tail-cuff blood pressure. The correlation coefficients (r) and P-values were obtained by Pearson’s correlation test, and lines were obtained by linear regression plotting.

