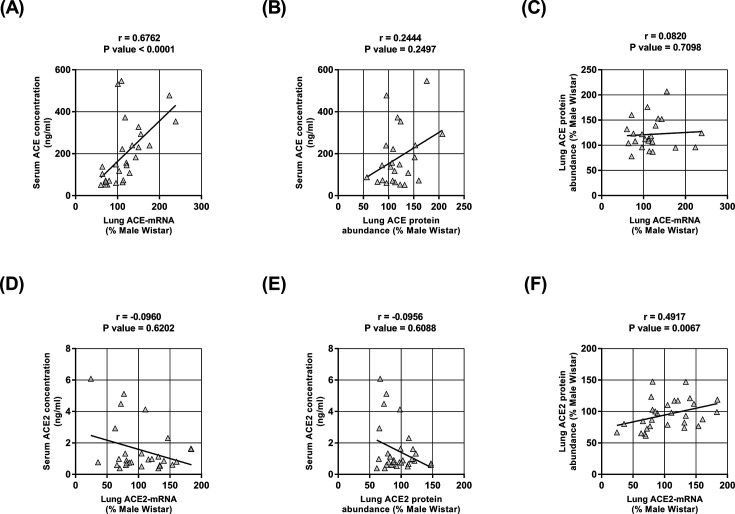
Figure 5. The relationship between the lung expression and serum concentrations of ACE and ACE2.
(A) Correlation between serum ACE concentration and lung ACE mRNA level. (B) The absence of a correlation between serum ACE concentration and lung ACE protein abundance. (C) The absence of a correlation between lung ACE protein abundance and lung ACE mRNA level. (D) The absence of a correlation between serum ACE2 concentration and lung ACE2 mRNA level. (E) The absence of a correlation between serum ACE2 abundance and lung ACE2 protein abundance. (F) Correlation between lung ACE2 protein abundance and lung ACE2 mRNA level. The correlation coefficients (r) and P-values were obtained by Pearson’s correlation test, and lines were obtained by linear regression plotting.

