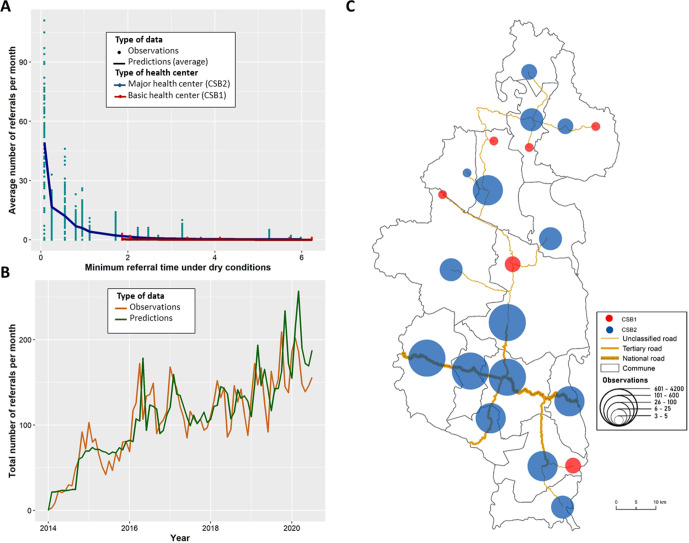
Figure 3.
Observed and predicted temporal and spatial trends for hospital referrals in Ifanadiana district, 2014–2020. (A) Average number of referrals completed by health centres each month as a function of the minimum referral time from the health centre to the hospital, stratified by type of health centre. (B) Evolution of the total number of referrals per month observed (brown line) and predicted (green line) over the study period. (C) Spatial distribution of hospital referrals by health centre (blue circles=CSB2 and red circles=CSB1), with larger circle size corresponding to a higher number of referrals completed by the health centre. CSB, primary care health centre (Centre de Santé de Base in French)

