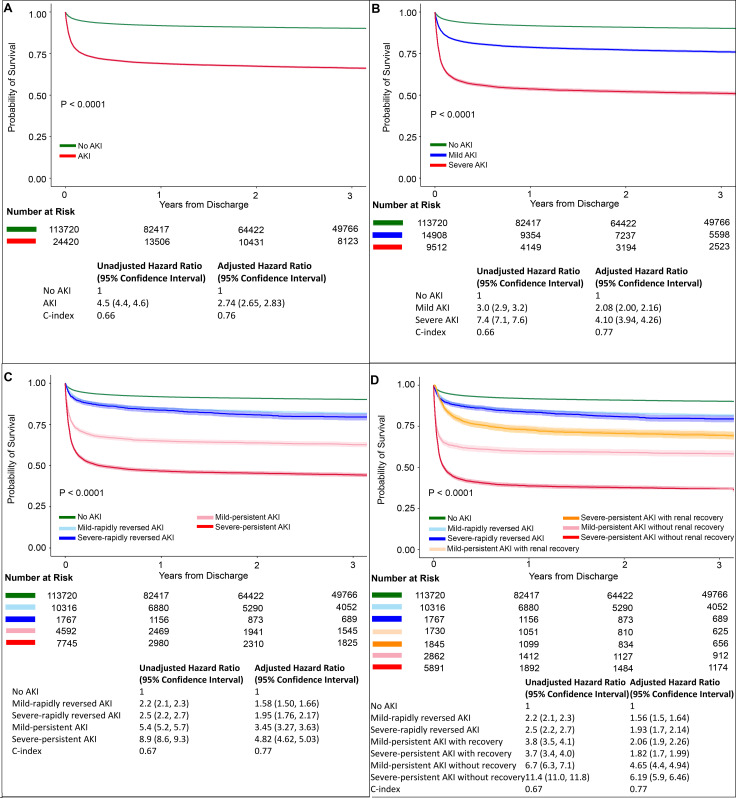
Figure 3.
Adjusted Kaplan-Meier survival curves and number at risk by AKI subphenotypes obtained stratifying by (A) no AKI vs any AKI (B) AKI stratified by severity (C) AKI stratified by severity and duration (D) AKI stratified by severity and trajectories of AKI using duration and recovery of AKI. Propensity score based inverse weighting was used to plot adjusted Kaplan-Meier curves where propensity of being in a trajectory group was calculated using multinomial logistic model that included age, gender, ethnicity and Charlson Comorbidity Index score. Adjusted hazard ratios were obtained adjusting for the same variables as well as need for mechanical ventilation for more than 2 days and need for intensive care unit admission for more than 2 days. AKI, acute kidney injury.

