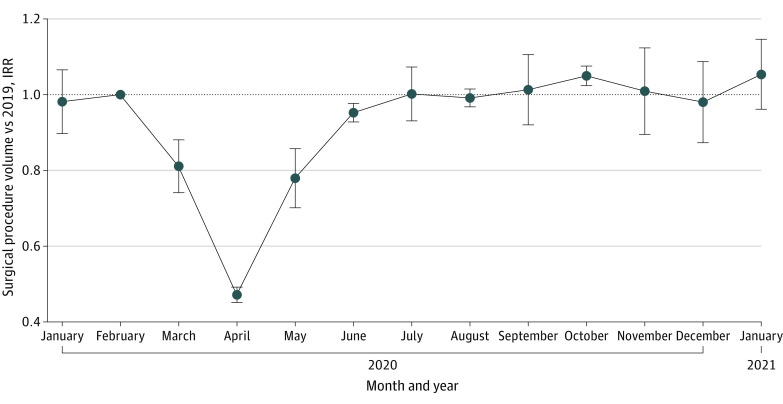
Figure 1. Surgical Procedure Volume Over Time as a Proportion of 2019 Volume.
Incidence rate ratios (IRRs) and 95% CIs (error bars) were estimated from Poisson regression by comparing total procedure counts during epidemiological weeks with corresponding weeks in 2019. All regression models included week-of-year fixed effects, and standard errors were clustered at the week level. Surgical procedure volume across all categories combined showed a significant decrease in 2020 compared with 2019 in March through June, as represented by IRR over time on the graph. IRR was not significantly different than 1.0 from July through January, indicating no change from 2019 procedure volume.

