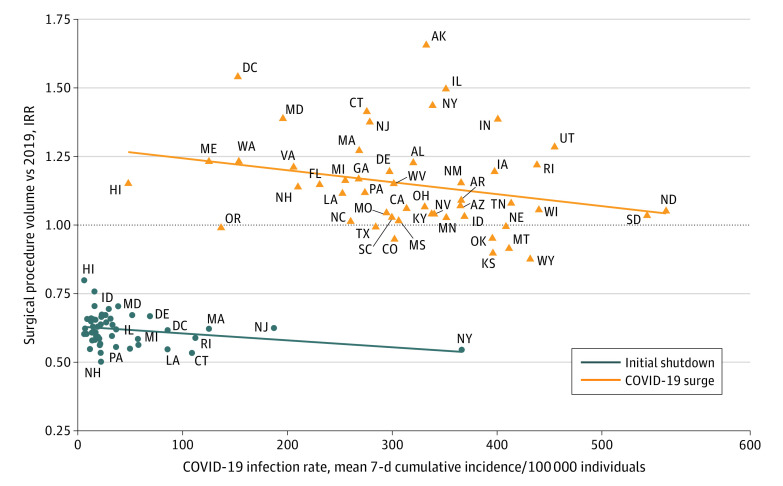
Figure 3. Change in Surgical Procedure Rate by Mean 7-Day Cumulative Incidence of COVID-19 per Population.
IRR indicates incidence rate ratio showing change in procedure volume from 2019 to 2020, estimated from Poisson regression by comparing total procedure counts during epidemiological weeks in 2020 with the corresponding weeks in 2019. Mean 7-day cumulative incidence of patients with COVID-19 per 100 000 population members by state was taken from the Centers for Disease Control and Prevention Data Tracker. A mean 7-day cumulative incidence rate was calculated for each epidemiological week and then the mean found over the initial shutdown period (ie, weeks 12-18 in 2020) and COVID-19 surge (ie, weeks 44 in 2020 through 4 in 2021). Correlation lines are plotted along the same x- and y-axis. During the initial shutdown (blue line), decrease in surgical procedure volume (by IRR) in each state was correlated with 7-day cumulative incidence rate of patients with COVID-19 (r = −0.00025; 95% CI, −0.0042 to −0.0009; P = .003). During the COVID-19 surge (orange line), there was no correlation.

