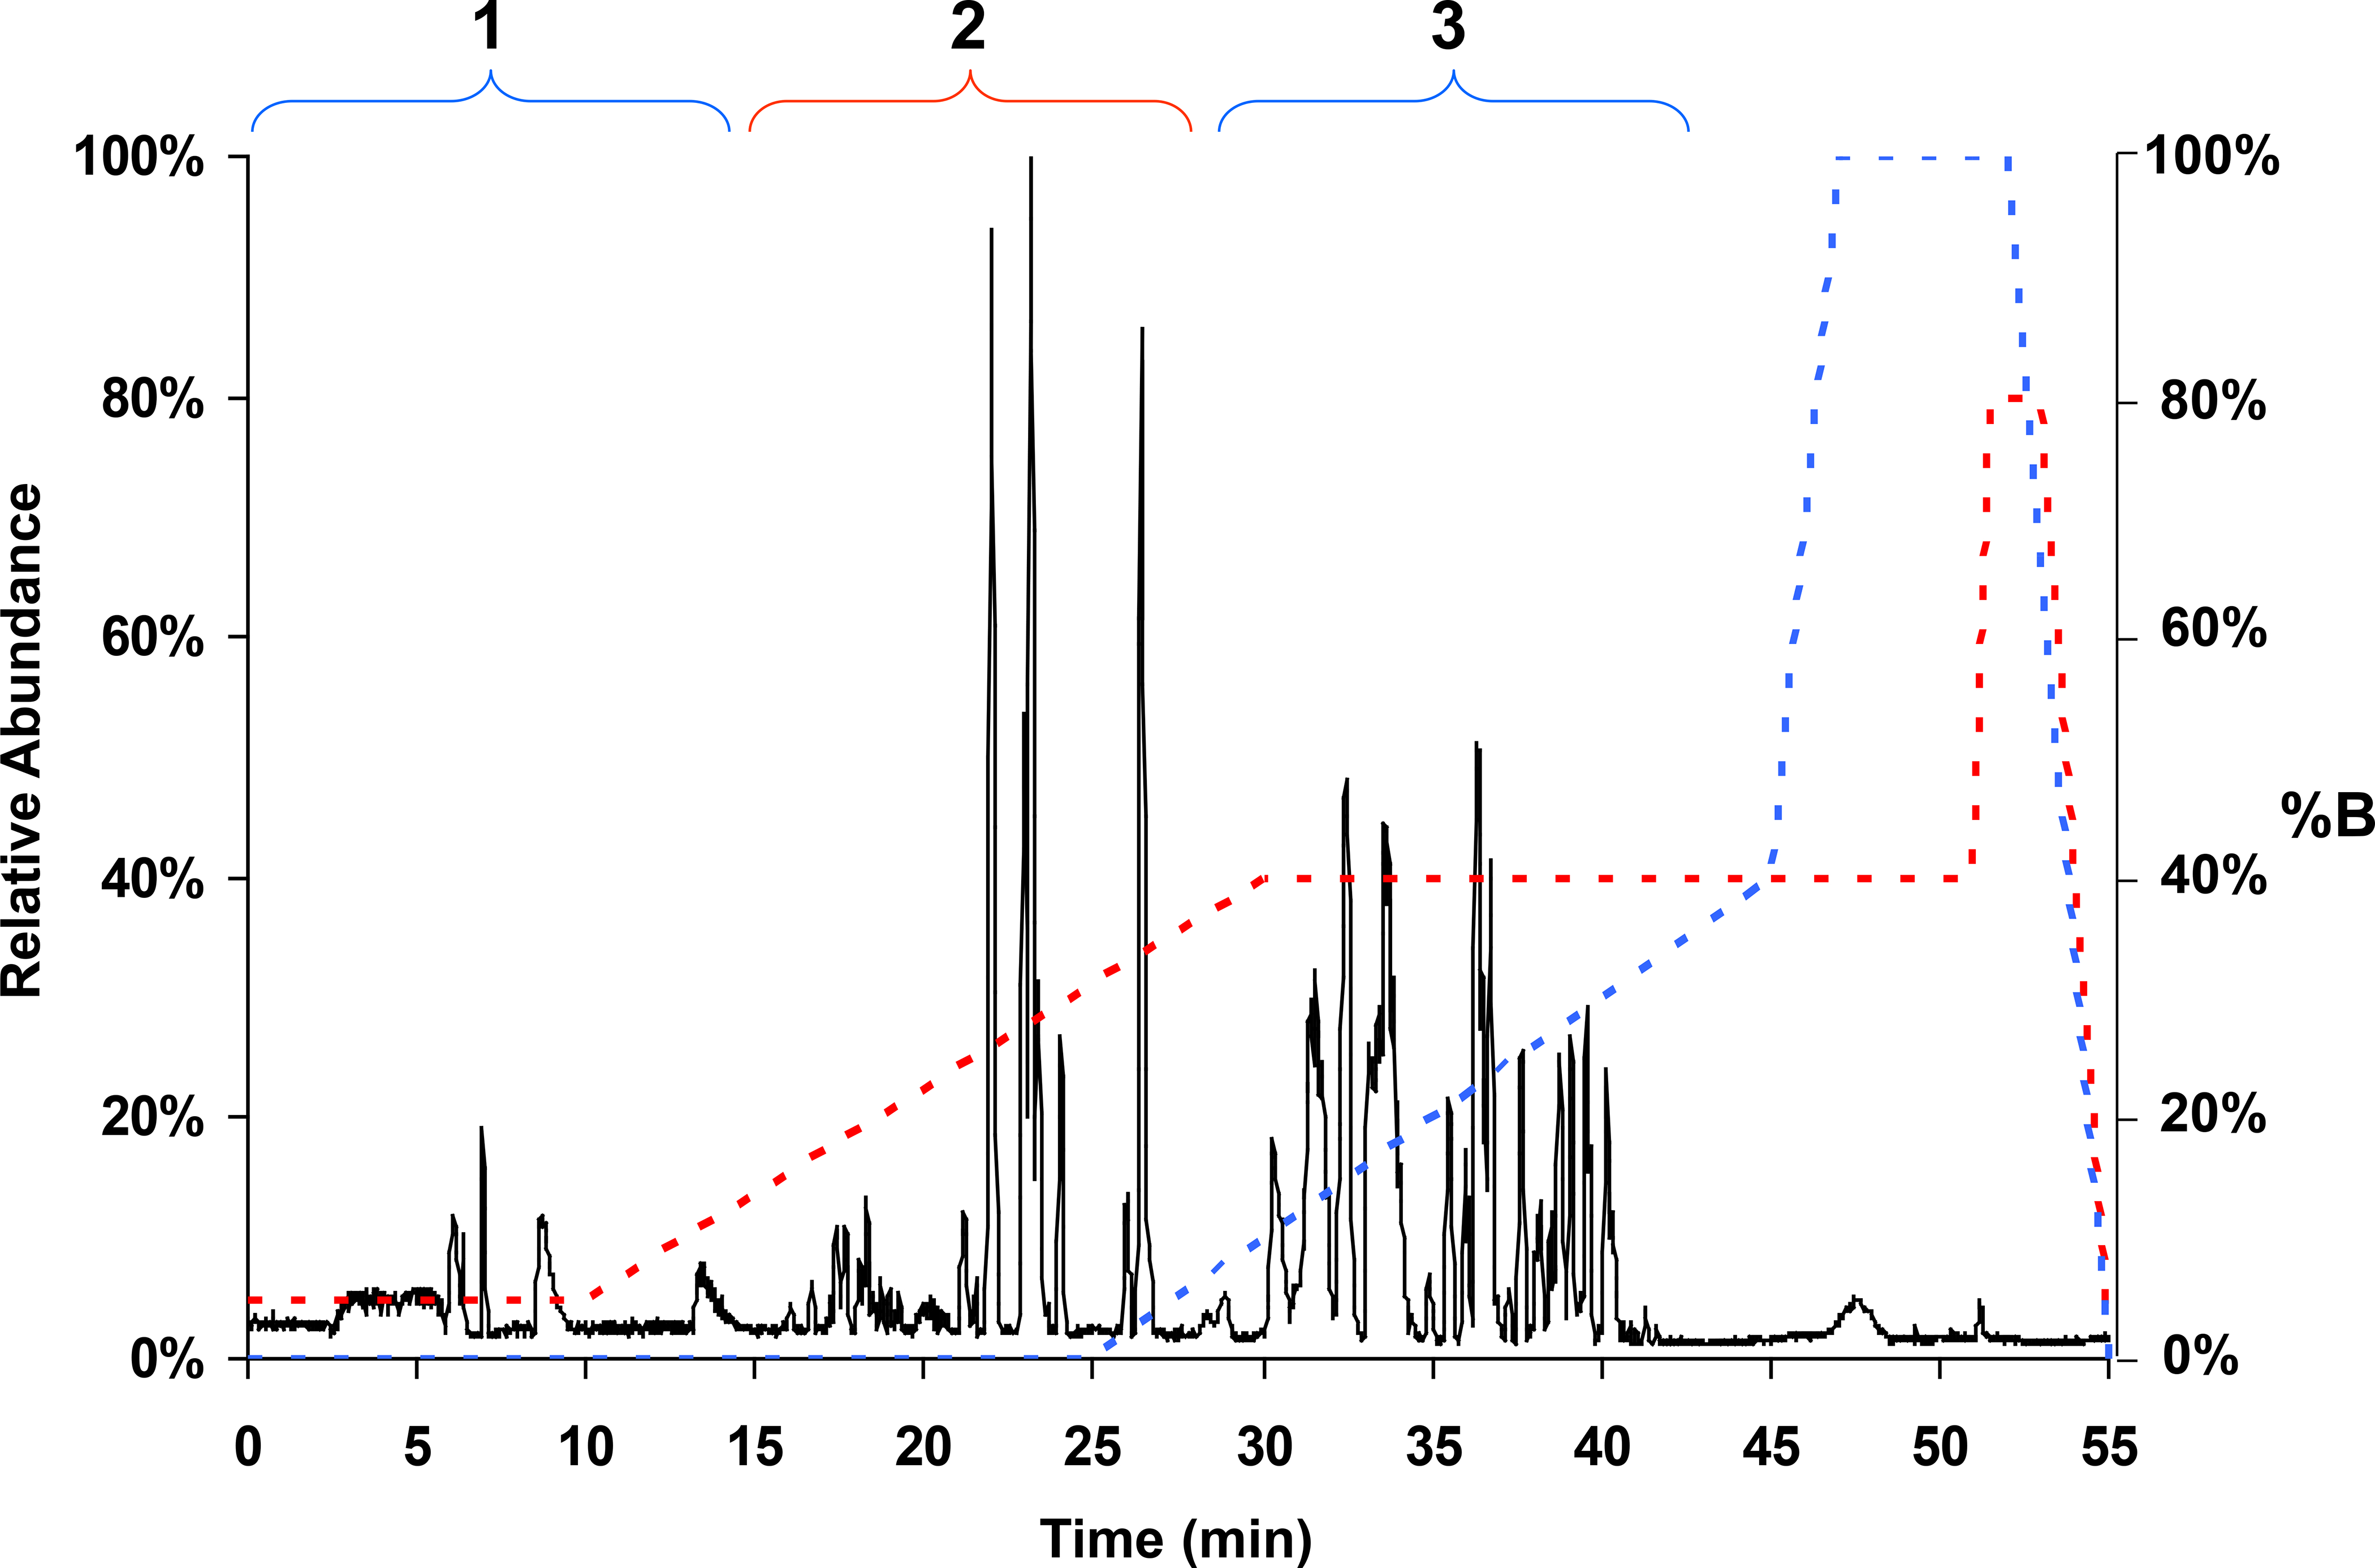
Figure 2.

LC-MS base-peak chromatogram from a trypsin digestion of human placenta-derived tissue factor. The y-axis left side is relative ion intensity or abundance, and the y-axis right side shows %B for the gradient profiles for pump 1 (blue) and pump 2 (red). Region 1 (1 to 13 min) represents elution of hydrophilic peptides that were not retained on the C8 trap and are weakly retained on the PGC column. This region extends into the beginning of the pump 2 gradient. Region 2 shows peptides that were retained on the C8 trap and sequentially eluted onto and separated by the C18 column during the C18 gradient. Region 3 (25 to 45 min) shows hydrophilic peptides that were retained by the PGC column and eluted during the pump 1 gradient.
