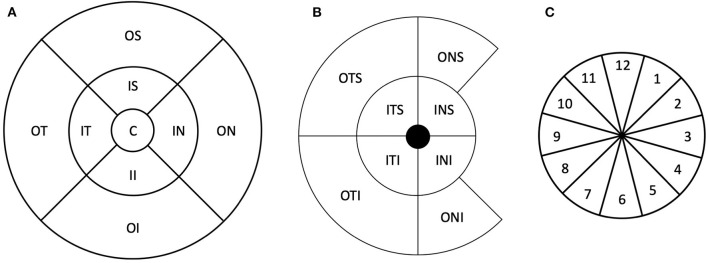
Figure 1.
Schematic representation of the thickness maps used in this study. (A) Early Treatment Diabetic Retinopathy Study sector map. (B) Ganglion cell complex map. (C) Schematic representation of the peripapillary retinal nerve fiber layer thickness sectors. The numbers represent the clock hour positions. C, central; IS, inner superior; OS, outer superior; IN, inner nasal; ON, outer nasal; II, inner inferior; OI, outer inferior; IT, inner temporal; OT, outer temporal; ITS, inner temporal superior; INS, inner nasal superior; INI, inner nasal inferior; ITI, inner temporal inferior; OTS, outer temporal superior; ONS, outer nasal superior; ONI, outer nasal inferior; OTI, outer temporal inferior.

