
Figure 3.
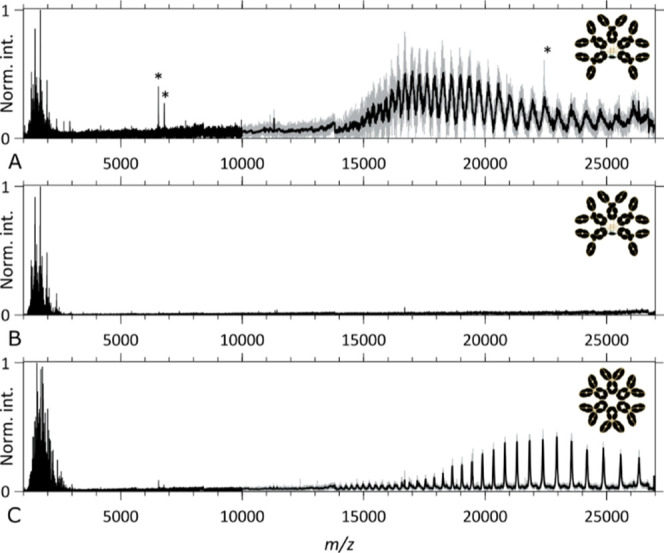
Native top-down ECD MS2 spectra of IgM- and IgG-based oligomeric immunoglobulins. (A,B) ECD MS2 spectra of the aWTA IgM assembly and (C) ECD MS2 spectra of the aCD52 hexameric IgG1 assembly. (A,C) ECD MS2 spectra taken with the “Analyzer CE-Inject (V) UHMR” at its default value of 3200, displaying the precursor ion signals and the ECnoD product ions at high m/z and backbone fragments below m/z 3000, respectively, for the aWTA IgM and the aCD52 hexameric IgG1 assemblies. (B) ECD MS2 spectrum of the aWTA IgM assembly taken with the “Analyzer CE-Inject (V) UHMR” at a value of 3700, optimized for “low m/z” fragment ion detection. * denotes noise peaks.