
Figure 5.
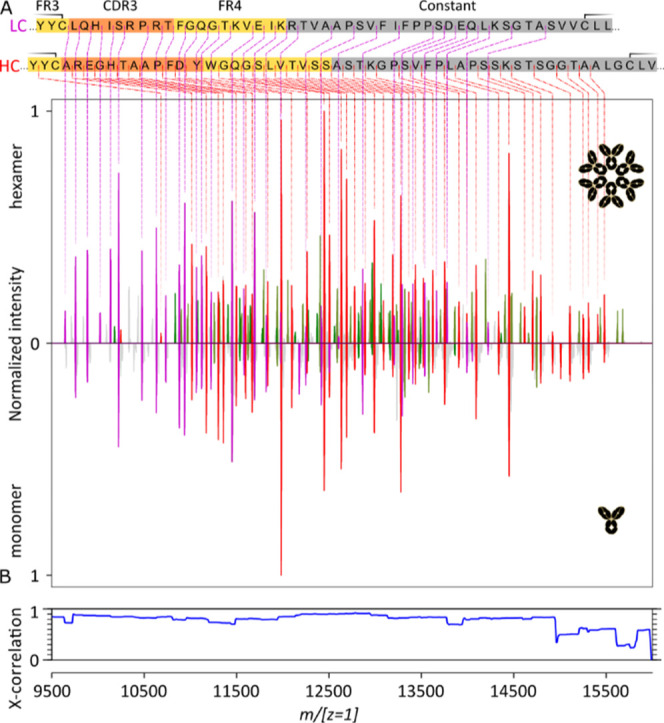
Comparison of the native top-down ECD fragment ion spectra of (IgG)6 and the corresponding monomeric IgG. (A) Charge-deconvoluted (m/[z = 1]) ECD spectra of the aCD52 IgG1 hexamer and its monomer (“Analyzer CE-Inject (V) UHMR” at 3200 in both cases). HC c-ions are in red, LC c-ions are in purple, and the green peaks correspond to LC a-ions. (B) Cross-correlation of the two native top-down ECD fragment ion spectra.