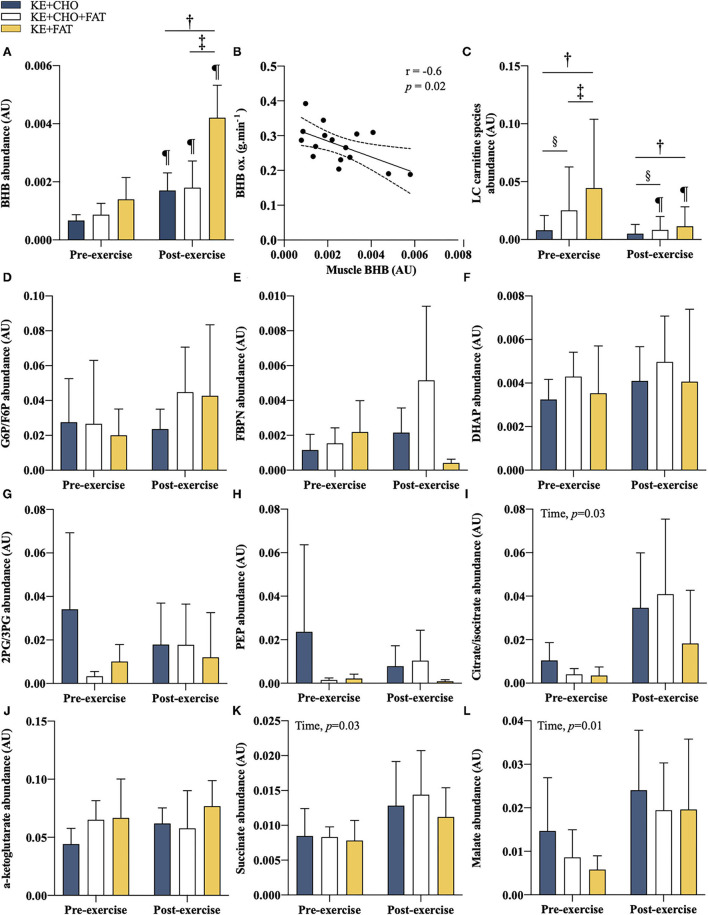
Figure 6.
Intramuscular metabolites. (A) βHB pre- and post-exercise. (B) Association between post-exercise intramuscular βHB and βHB oxidation rate at t = 60 min. Limits represent 95% CI. (C) Long-chain acylcarnitines (C12 to C18) abundance pre- and post-exercise. (D) glucose 6 phosphate (G6P)/fructose 6-phosphate (F6P) pre- and post-exercise. (E) fructose 1,6-bisphosphate (FBPN) pre- and post-exercise. (F) dihydroxyacetone phosphate (DHAP) pre- and post-exercise. (G) 2-Phosphoglyceric acid (2PG)/3-Phosphoglyceric acid (3PG) pre- and post-exercise. (H) phosphoenolpyruvic acid (PEP) pre- and post-exercise. (I) Citrate/isocitrate pre- and post-exercise. (J) α-ketoglutarate pre- and post-exercise. (K) Succinate pre- and post-exercise. (L) Malate pre- and post-exercise. Significant post-hoc comparisons: † = KE+CHO vs. KE+FAT; ‡ = KE+CHO+FAT vs. KE+FAT; § = KE+CHO vs. KE+CHO+FAT; ¶ = Pre- vs. post-exercise. Values = mean ± SD.

