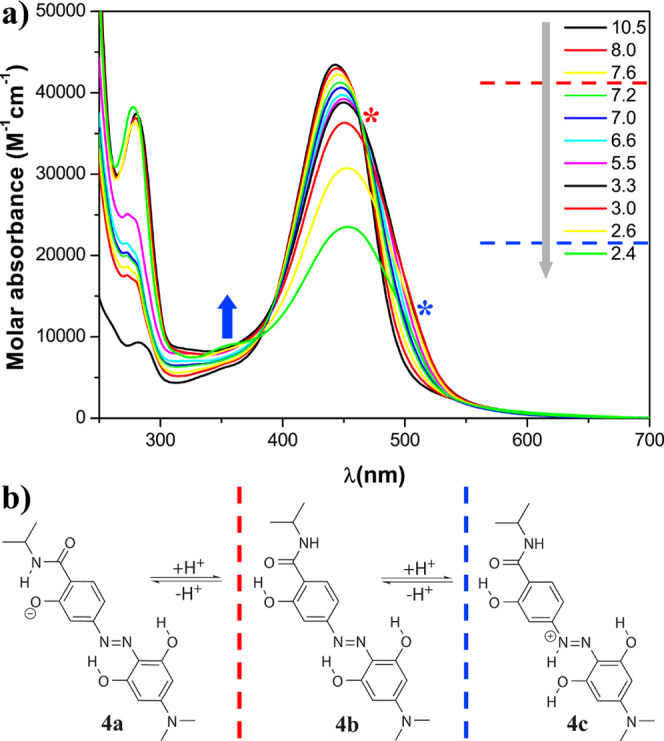
Figure 3.

(a) pH dependence of the molar absorbance at 20 °C of hydrodabcyl isopropylamide (4) in an aqueous mixture of buffers CAPS, CHES, HEPES, MES, and ammonium acetate, each present at 15 mM and (b) protonation states. The gray arrow represents the experimental acidification of the solution. The red dashed line indicates the putative pH range of the protonation of the phenolate, and the red asterisk indicates the corresponding spectral effect, that is, the isosbestic point. The blue dashed line indicates the putative pH range of the protonation of the diazo group, and the corresponding spectral effects are indicated by the blue arrow showing the appearance of the local maximum at 350 nm and the blue asterisk showing the shoulder at around 500 nm visible below pH 2.6.
