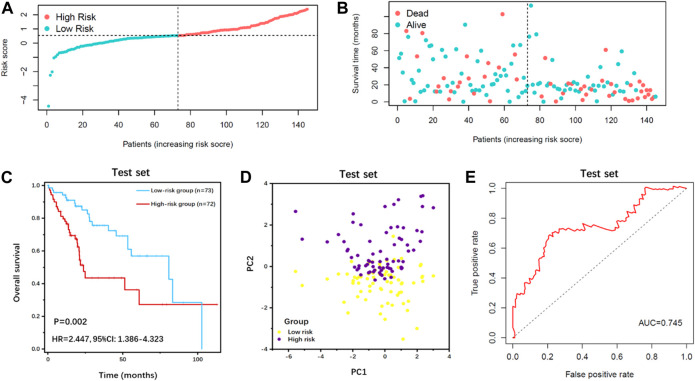
FIGURE 4.
Survival analysis of IFLSig in the test cohort. (A) Distribution of IFLSig of HCC cases, which were categorized into two groups based on the median of risk score. (B) Distribution of survival time of HCC cases. The positions of the dots reveal the association between the IFLSig and survival time. (C) K-M curve for IFLSig relative to the overall survival of the test cohort. (D) PCA plot of the test cohort. (E) ROC curve of the sensitivity and specificity of survival time on the risk score.

