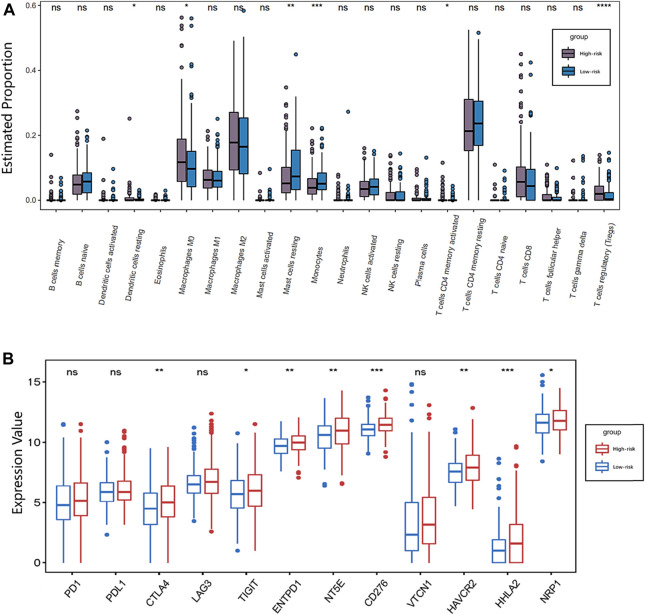
FIGURE 6.
Immunotherapy response analysis. (A) Boxplot showing the association between IFLSig and immune cell lines; ANOVA was used as the significance test, *p < 0.05, **p < 0.01, ***p < 0.001, and ****p < 0.0001. (B) Boxplot showing the association between IFLSig and immune checkpoints; ANOVA was used as the significance test, *p < 0.05, **p < 0.01, ***p < 0.001, and ****p < 0.0001. GSEA, Gene Set Enrichment Analysis; KEGG, Kyoto Encyclopedia of Genes and Genomes; TCGA, The Cancer Genome Atlas.

