FIGURE 8.
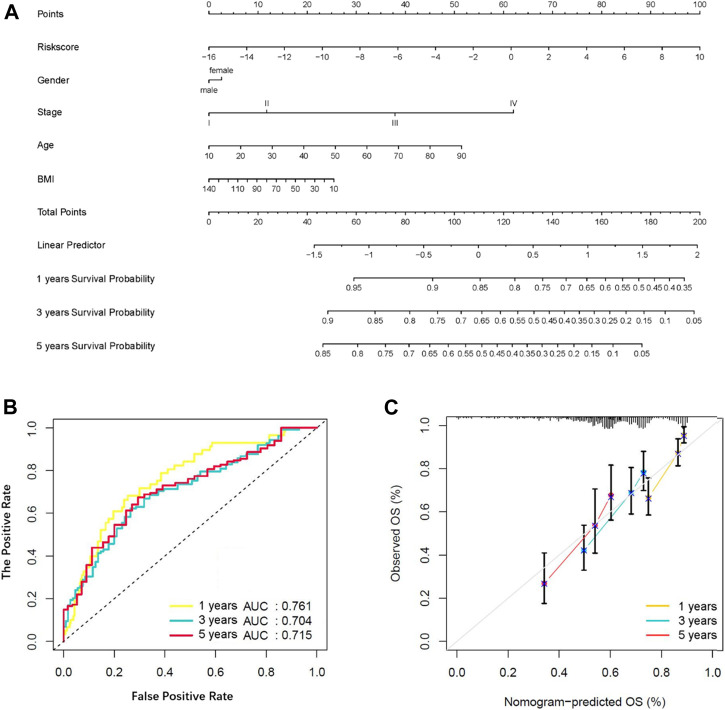
Construction and verification of a nomogram. (A) Survival nomogram based on total TCGA cohort. (B) The ROC curve compared the prognostic power of the nomogram at 1, 3, and 5 years in the TCGA cohort. (C) The calibration curve for predicting HCC patient survival at 1, 3, and 5 years in the TCGA cohort.

