Figure 7.

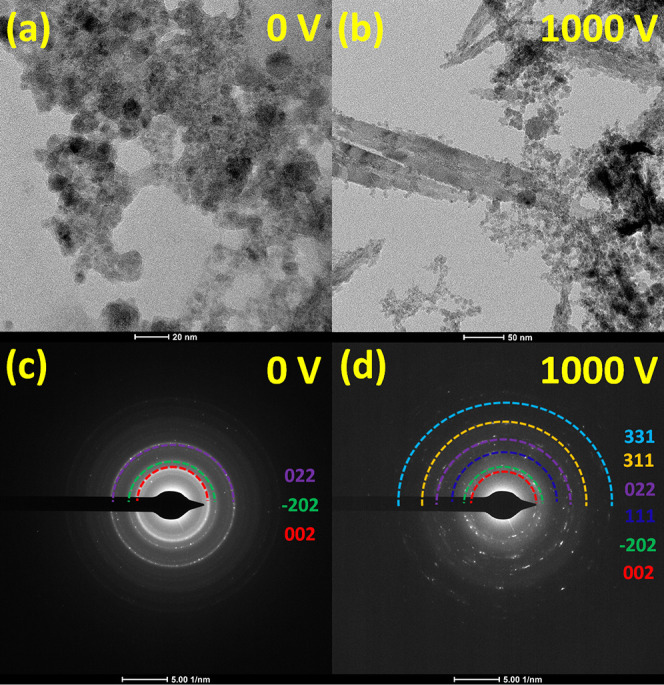
(a, b) TEM images of the CuxO NSs synthesized at 5.1 kHz under a potential difference of 0 and 1000 V, respectively. (c, d) Electron diffraction patterns corresponding to the TEM images shown in (a) and (b), respectively.

(a, b) TEM images of the CuxO NSs synthesized at 5.1 kHz under a potential difference of 0 and 1000 V, respectively. (c, d) Electron diffraction patterns corresponding to the TEM images shown in (a) and (b), respectively.