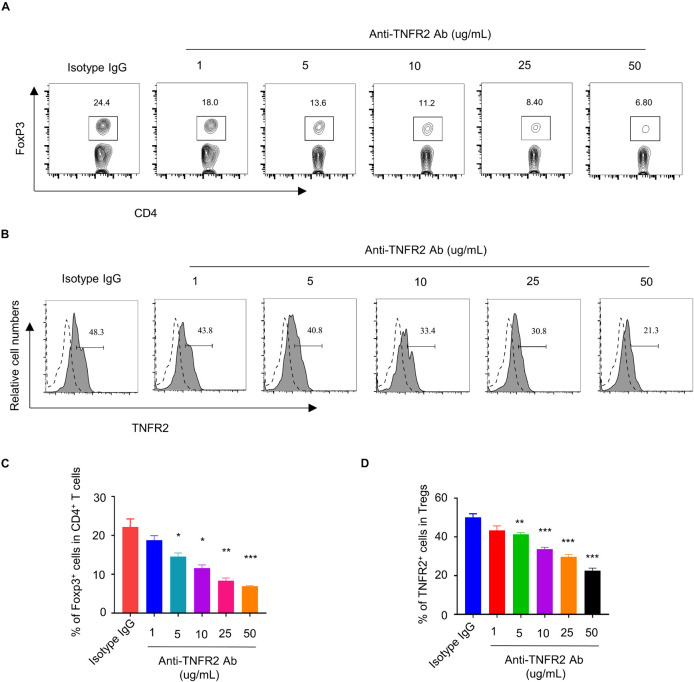
FIGURE 3.
Anti-TNFR2 antibody decreases the percentage of regulatory T cells (Tregs) in CD4+ T-cell population and downregulates TNFR2 expression. (A) Fluorescence-activated cell sorting (FACS) analysis of Foxp3 intracellular staining in CD4+ T cells after anti-TNFR2 antibody treatment. (B) FACS analysis of TNFR2 expression in CD4+Foxp3+ Tregs after anti-TNFR2 antibody treatment. Dotted line: TNFR2 antibody isotype IgG staining. Solid line: TNFR2 staining. (C) Summarized data of the proportion of CD4+Foxp3+ Tregs in CD4+ T-cell population. (D) Summary of the percentage of TNFR2-positive cells. Data are the summary of three independent experiments. *p < 0.05, **p < 0.01, ***p < 0.001.

