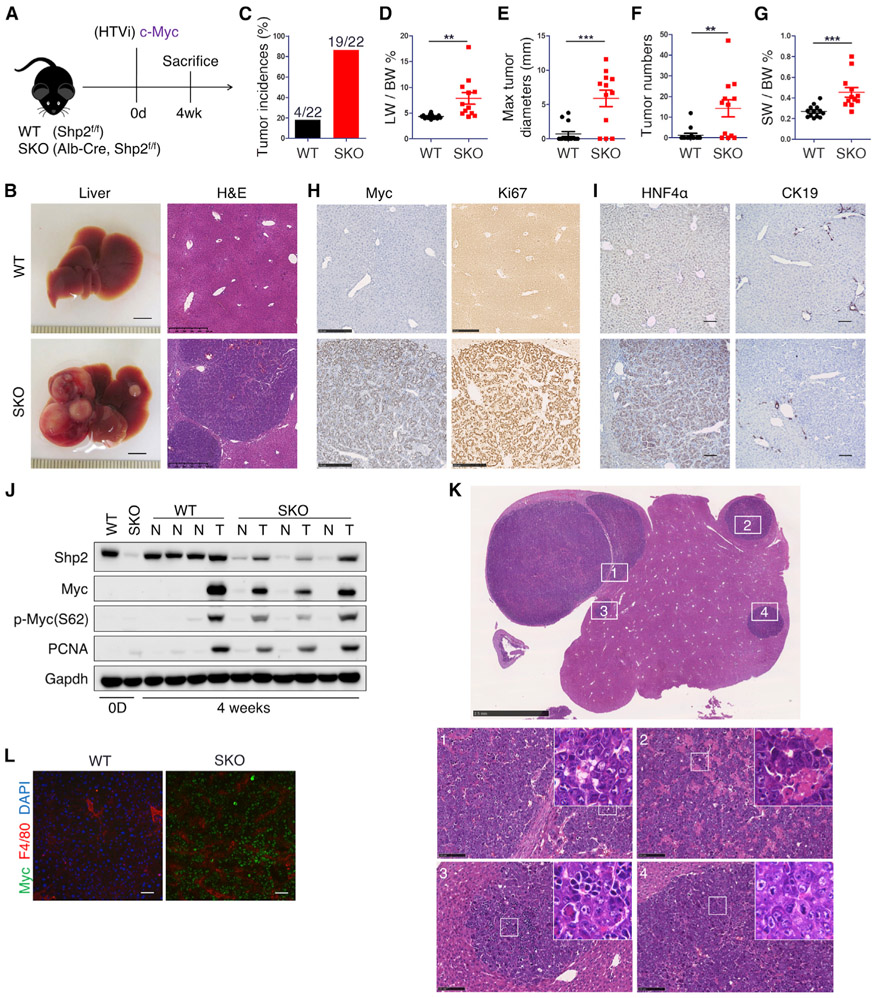
Figure 1. Myc alone robustly drives tumorigenesis in Shp2-deficient liver.
(A) Experimental scheme.
(B) Representative liver images and H&E staining of liver sections 4 weeks after Myc transfection with SB-11 transposase via HTVi. Liver scale bars, 0.5 cm. Staining scale bars, 500 μm.
(C–G) Quantified tumor incidences (C), liver-to-body weight ratios (LW/BW) (D), maximal tumor diameters (E), visible tumor nodule numbers (F), and spleen-to-body weight ratios (SW/BW) (G). n = 22. Values are presented as means ± SD. Statistical significance was calculated using Students’ t test (**p < 0.01, ***p < 0.001).
(H and I) Representative immunostaining of liver sections for Myc and Ki67 (H) and HNF4α and CK19 (I) 4 weeks after Myc transfection. Scale bars, 250 μm (H) and 50 μm (I).
(J) Immunoblotting of liver lysates at 0 days (0D) and 4 weeks after HTVi of Myc, using antibodies as indicated. T, tumor tissue; N, non-tumor liver tissue.
(K) Representative H&E staining of SKO liver 4 weeks post-Myc injection. For trabecular HCC with features detailed in histopathological report, see Table S1. Scale bars, 2.5 mm (top) and 100 μm (bottom 1–4). Upper box, ×4.
(L) Immunostaining of Myc, F4/80 and DAPI in WT versus SKO (tumor) 4 weeks after HTVi of Myc. Scale bars, 100 μm.

