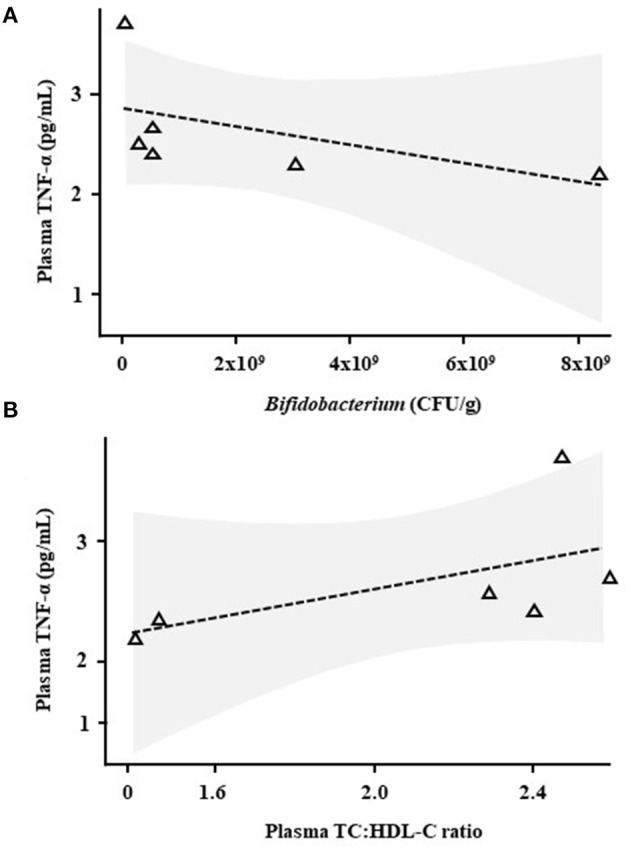
Figure 3.

Correlative analysis in Wistar rats after 90 days supplementation with Lab4. Scatter plots between plasma tumour necrosis factor-α (TNF-α) levels and (A) faecal Bifidobacterium levels or (B) the plasma TC:HDL-C ratio in rats receiving Lab4 for 90 days. Analysis was performed on pairwise data from six rats. TNF, tumour necrosis factor; TC, total cholesterol; HDL-C, high density lipoprotein cholesterol.
