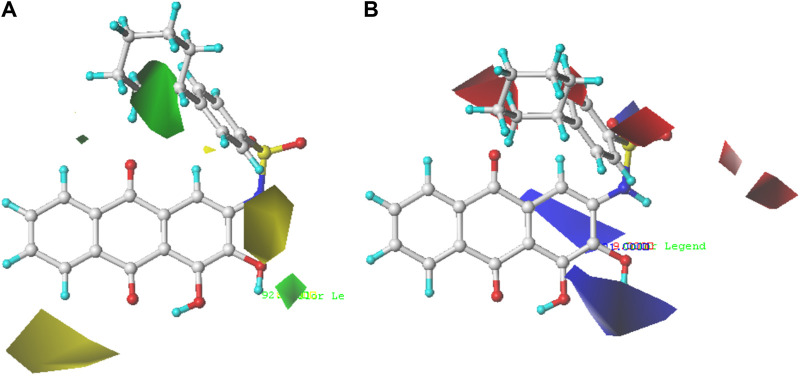
FIGURE 3.
Steric contour map (A) and electrostatic contour map (B) of the CoMFA model based on molecule 35. Green regions represent bulky groups that increase anti-PGAM1 activity, while yellow regions represent sterically unfavored regions. Blue regions show where positive groups are beneficial for increasing anti-PGAM1 acitivity, and red regions show where negative groups are favored.

