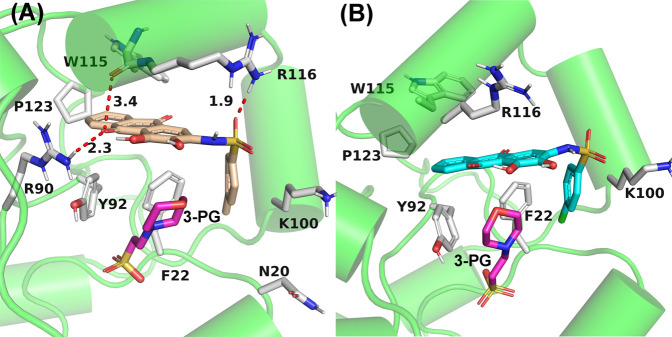
FIGURE 9.
Average structures of PGAM1 with compounds 23 (A) and 49 (B). The bonds of residues and ligands are represented in stick, and the carbon atoms of compound 23, compound 49, and residues are represented in yellow, cyan, and white, respectively. The red dotted line represents the hydrogen bond.

