
FIGURE 3.
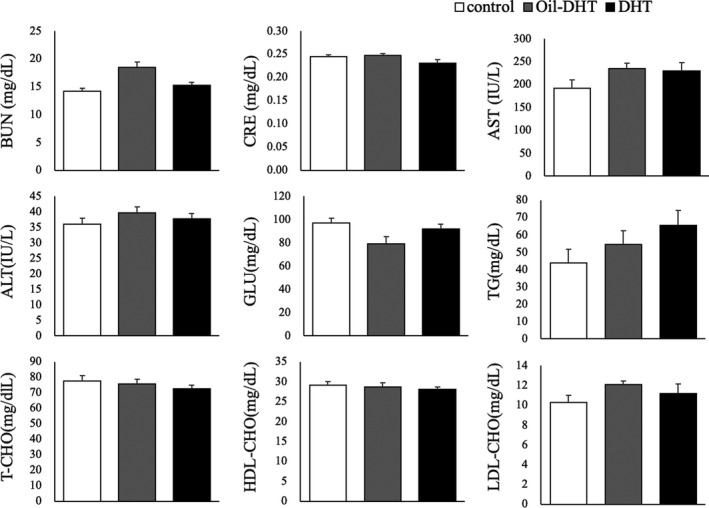
Serum levels of various biochemical factors on the day of tissue sampling in the control, Oil‐DHT, and DHT groups (n=9−10 per group). Data are expressed as the mean ± SEM
Official websites use .gov
A
.gov website belongs to an official
government organization in the United States.
Secure .gov websites use HTTPS
A lock (
) or https:// means you've safely
connected to the .gov website. Share sensitive
information only on official, secure websites.
Serum levels of various biochemical factors on the day of tissue sampling in the control, Oil‐DHT, and DHT groups (n=9−10 per group). Data are expressed as the mean ± SEM