FIGURE 6.

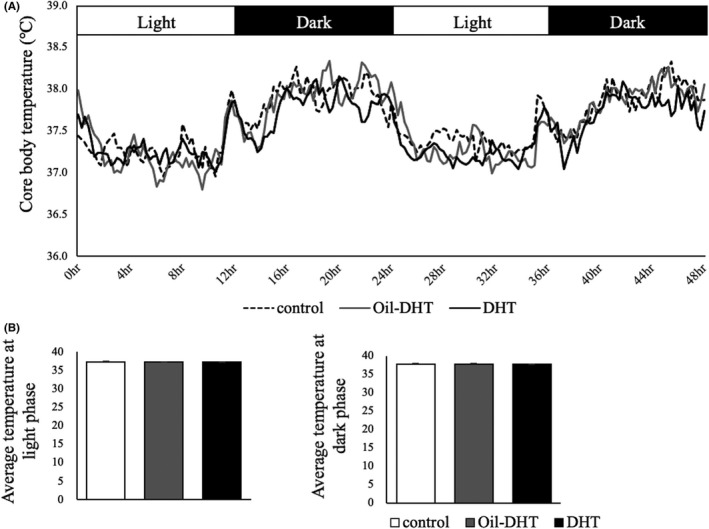
(A) Core body temperature and (B) mean temperature in the light and dark phases in the control, Oil‐DHT, and DHT groups (n=9−10 per group). Data are expressed as the mean ± SEM

(A) Core body temperature and (B) mean temperature in the light and dark phases in the control, Oil‐DHT, and DHT groups (n=9−10 per group). Data are expressed as the mean ± SEM