FIGURE 2.

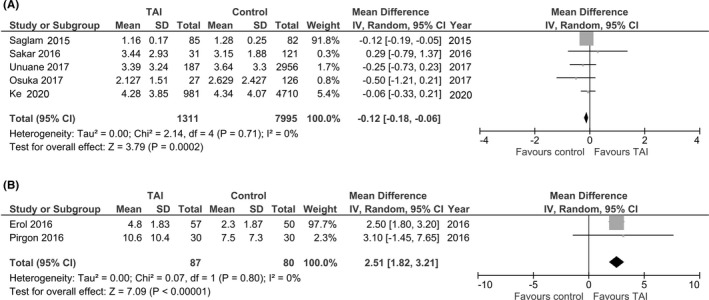
Forest plot (random‐effect model) of the weighted mean differences of the AMH level in women with thyroid autoimmunity (TAI) compared with controls. (A), adults and (B), adolescents

Forest plot (random‐effect model) of the weighted mean differences of the AMH level in women with thyroid autoimmunity (TAI) compared with controls. (A), adults and (B), adolescents