
FIGURE 3.
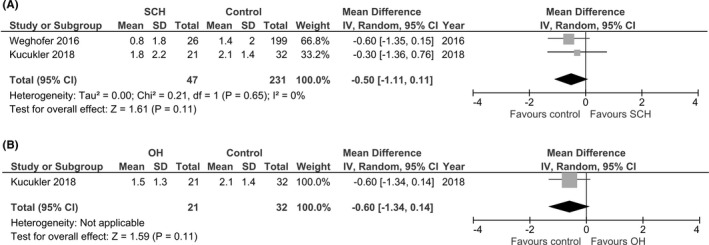
Forest plot (random‐effect model) of the weighted mean differences in the AMH level in women with (A) subclinical hypothyroidism (SCH) and (B) over hypothyroidism (OH) compared with controls
Official websites use .gov
A
.gov website belongs to an official
government organization in the United States.
Secure .gov websites use HTTPS
A lock (
) or https:// means you've safely
connected to the .gov website. Share sensitive
information only on official, secure websites.
Forest plot (random‐effect model) of the weighted mean differences in the AMH level in women with (A) subclinical hypothyroidism (SCH) and (B) over hypothyroidism (OH) compared with controls