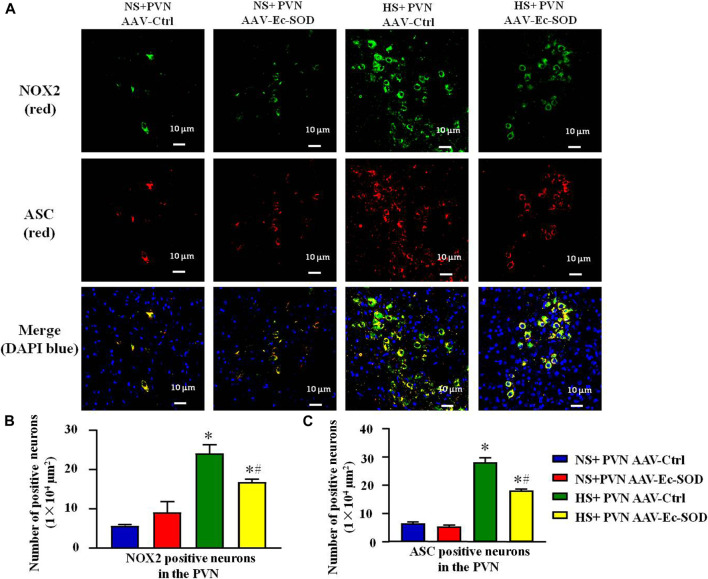
FIGURE 4.
Effect of AAV-Ec-SOD on NOX2 and ASC-positive neurons in the PVN. (A) Double fluorescence staining for NOX2- and ASC-positive neurons in the PVN in different groups. (B–C) Column diagram showing the NOX2 and ASC-positive neurons in the PVN in different groups. Values are expressed as mean ± SEM (n = 6). *p < 0.05 NS + PVN AAV-Ctrl vs. HS + PVN AAV-Ec-SOD; # p < 0.05 HS + PVN AAV-Ctrl vs. HS + PVN AAV-Ec-SOD.

