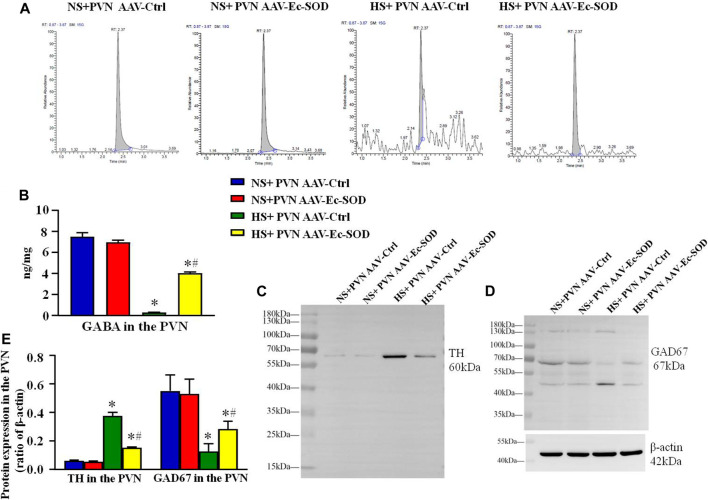
FIGURE 7.
Effect of AAV-Ec-SOD on the neurotransmitter-related proteins in the PVN (A) High-performance liquid chromatography chromatograms of GABA in the PVN in different groups. (B) Column diagram for the PVN level of GABA in different groups. (C–D) Representative immunoblot and (E) densitometric analysis of PVN expression levels of TH and GAD67 in the different groups. Values are expressed as mean ± SEM (n = 4–6). *p < 0.05 NS + PVN AAV-Ctrl vs. HS + PVN AAV-Ec-SOD; # p < 0.05 HS + PVN AAV-Ctrl vs. HS + PVN AAV-Ec-SOD.

