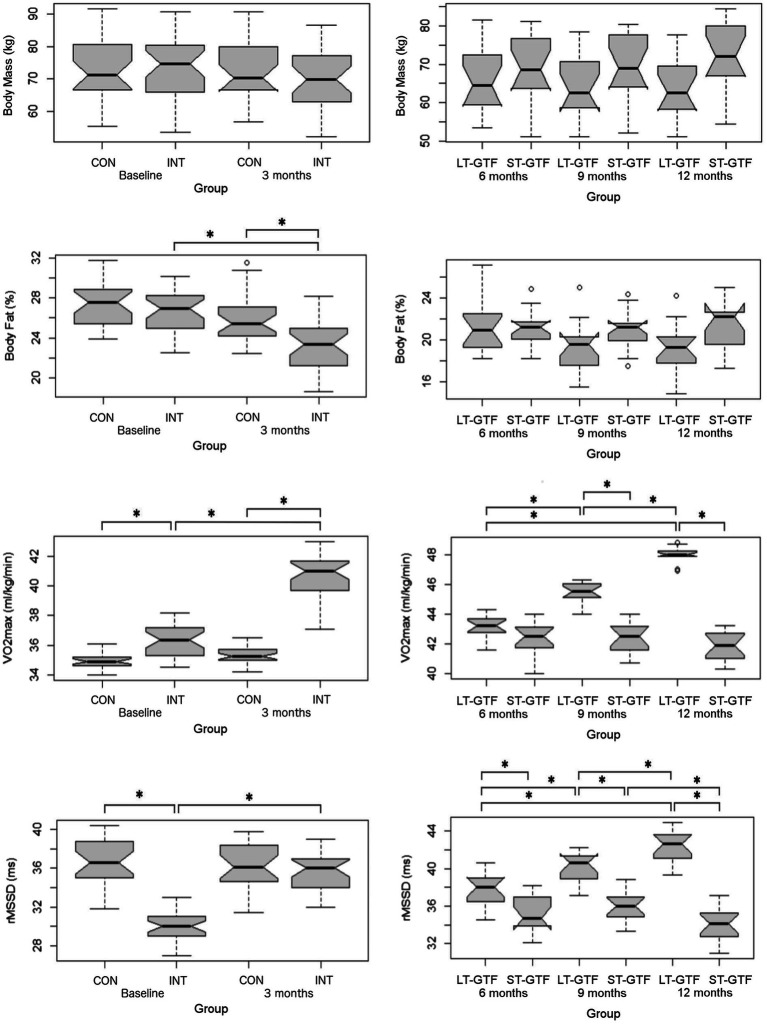
Figure 3.
Anthropometrics (Body Mass, BF%), cardiovascular fitness (VO2max), and autonomous nervous system (rMSSD) data. Graphs on the left represent control (CON) and intervention (INT) groups from baseline to month 3. Graphs on the right represent measurements taken at 6, 9, and 12months. LT-GTF, Long-term GTF group; ST-GTF, Short-term GTF. *Represent statistically significant differences.

