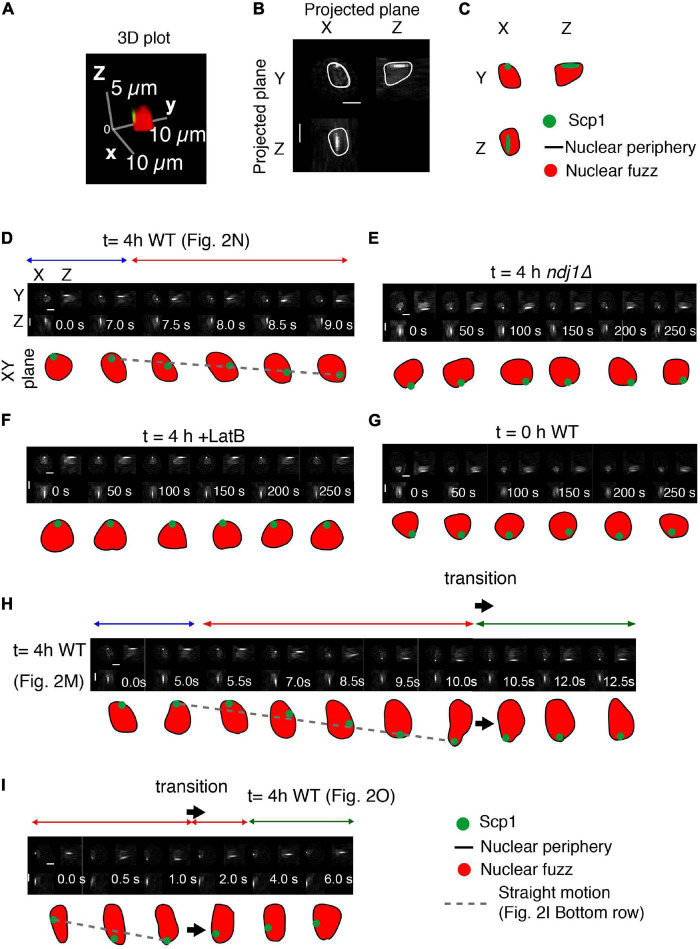
FIGURE 3.
Interplay between telomeres and nuclear envelope. (A–C) Analysis of a representative nucleus showing the definition of the nucleus, based on the nuclear fuzz (red) that is derived from the unbound TetR-mEGFP in the nucleus, and thus the nuclear periphery (NP; black line) plus the position of the spot corresponding to scp1::tetO-TetR-mEGFP. (A) 3D representation. (B) Projections onto the XY, XZ, and YZ planes. (C) Interpretation. (D–I) Projected images of the nuclear region and tagged SCP1 locus with the nature of spot motion (above; horizontal arrows). Sequences in (D,H,I) are from the trajectories shown in Figures 2M–O, respectively. Scale bar is 2 μm.

