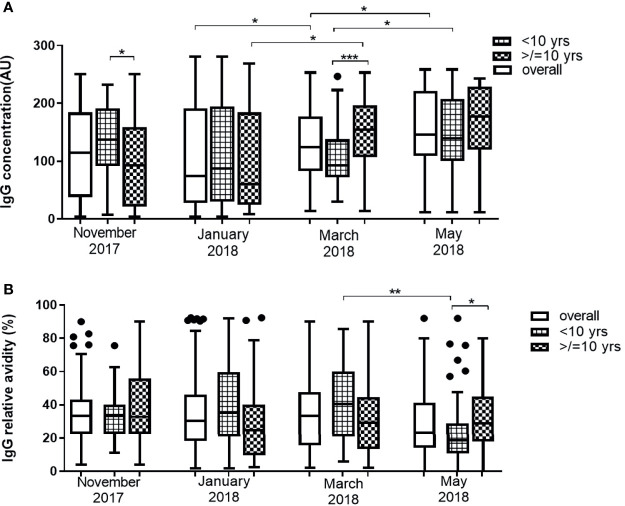
Figure 3.
Changes in Pfs230 IgG level (A) and avidity (B) in 43 children <10 years and 41 children ≥10 years over the dry season spanning November 2017 to May 2018. The extent of statistically significant difference in measurements indicated by *, ** and *** represent P <0.05, P <0.01, and P <0.001 respectively.

