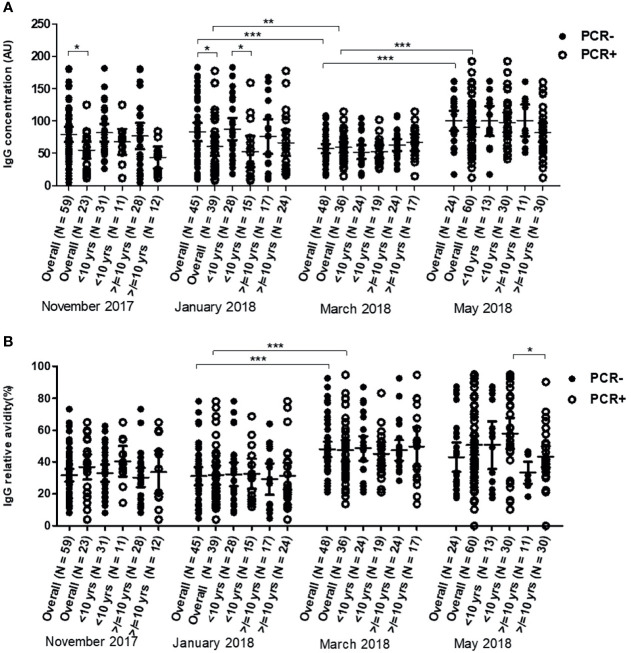
Figure 5.
Variations in of anti-Pfs48/45 IgG levels (A) and Relative avidities (B) in young children (<10 years) and older children (≥10 years) with (positive polymerase chain reaction test result) and without (negative-polymerase chain reaction test result) active P. falciparum infections over the dry season from November 2017 to May 2018. The number above each of the aligned dot plots represents the number of individuals in the group. The extent of statistically significant difference in measurements indicated by *, ** and *** represent P <0.05, P <0.01, and P <0.001 respectively.

