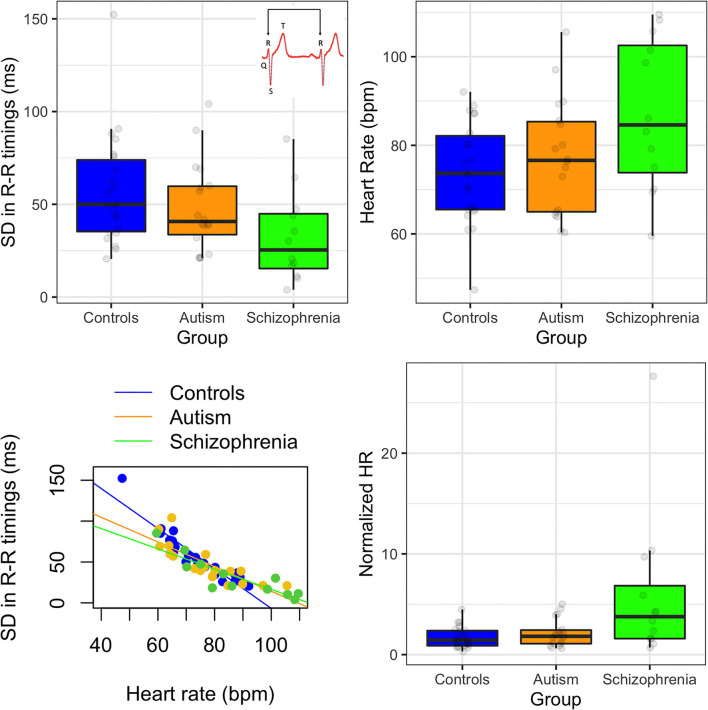
Figure 1.
(Top left) Standard deviation in R-R peak timings in controls, autism, and schizophrenia; insert showing an example waveform with labeled peaks. (Top right) Heart rate in beats per minute (bpm) for each group. (Bottom left) relationship between heart rate and standard deviation in R-R timings. (Bottom right) normalized heart rate by variability for each group. Error bars show 95% confidence intervals.

