
Fig. 5.
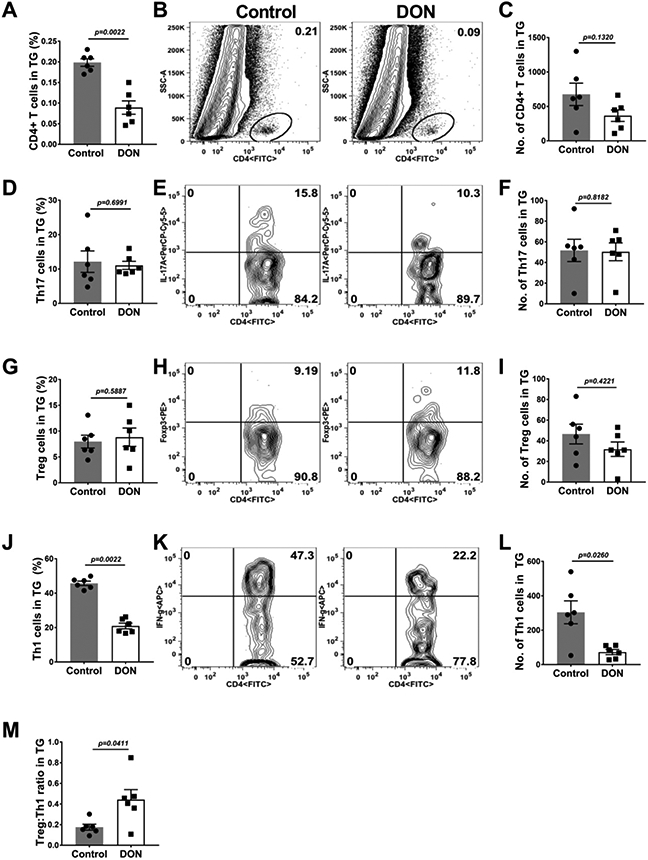
Therapeutic administration of DON diminished pro-inflammatory T cell responses in the TGs. C57BL/6 mice were ocularly infected with HSV-1, DON (0.3 mg/kg) and PBS was administered from day 6 till 15 PI and FACS analysis was performed on day 15 PI. Histograms and plot analysis represent total CD4+ T cells frequencies (A and B) and numbers (C), Th17 cells frequencies (D and E) and numbers (F), Treg cell frequencies (G and H) and numbers (I) and the Th1 frequency (J and K) and numbers (L). Fig 5 M shows the ratio of Th1:Treg on both control and DON treated animal TGs. The data represent mean results ± SEM. All data were analysed by Mann-Whitney U test (experiments repeated three times with n=6).