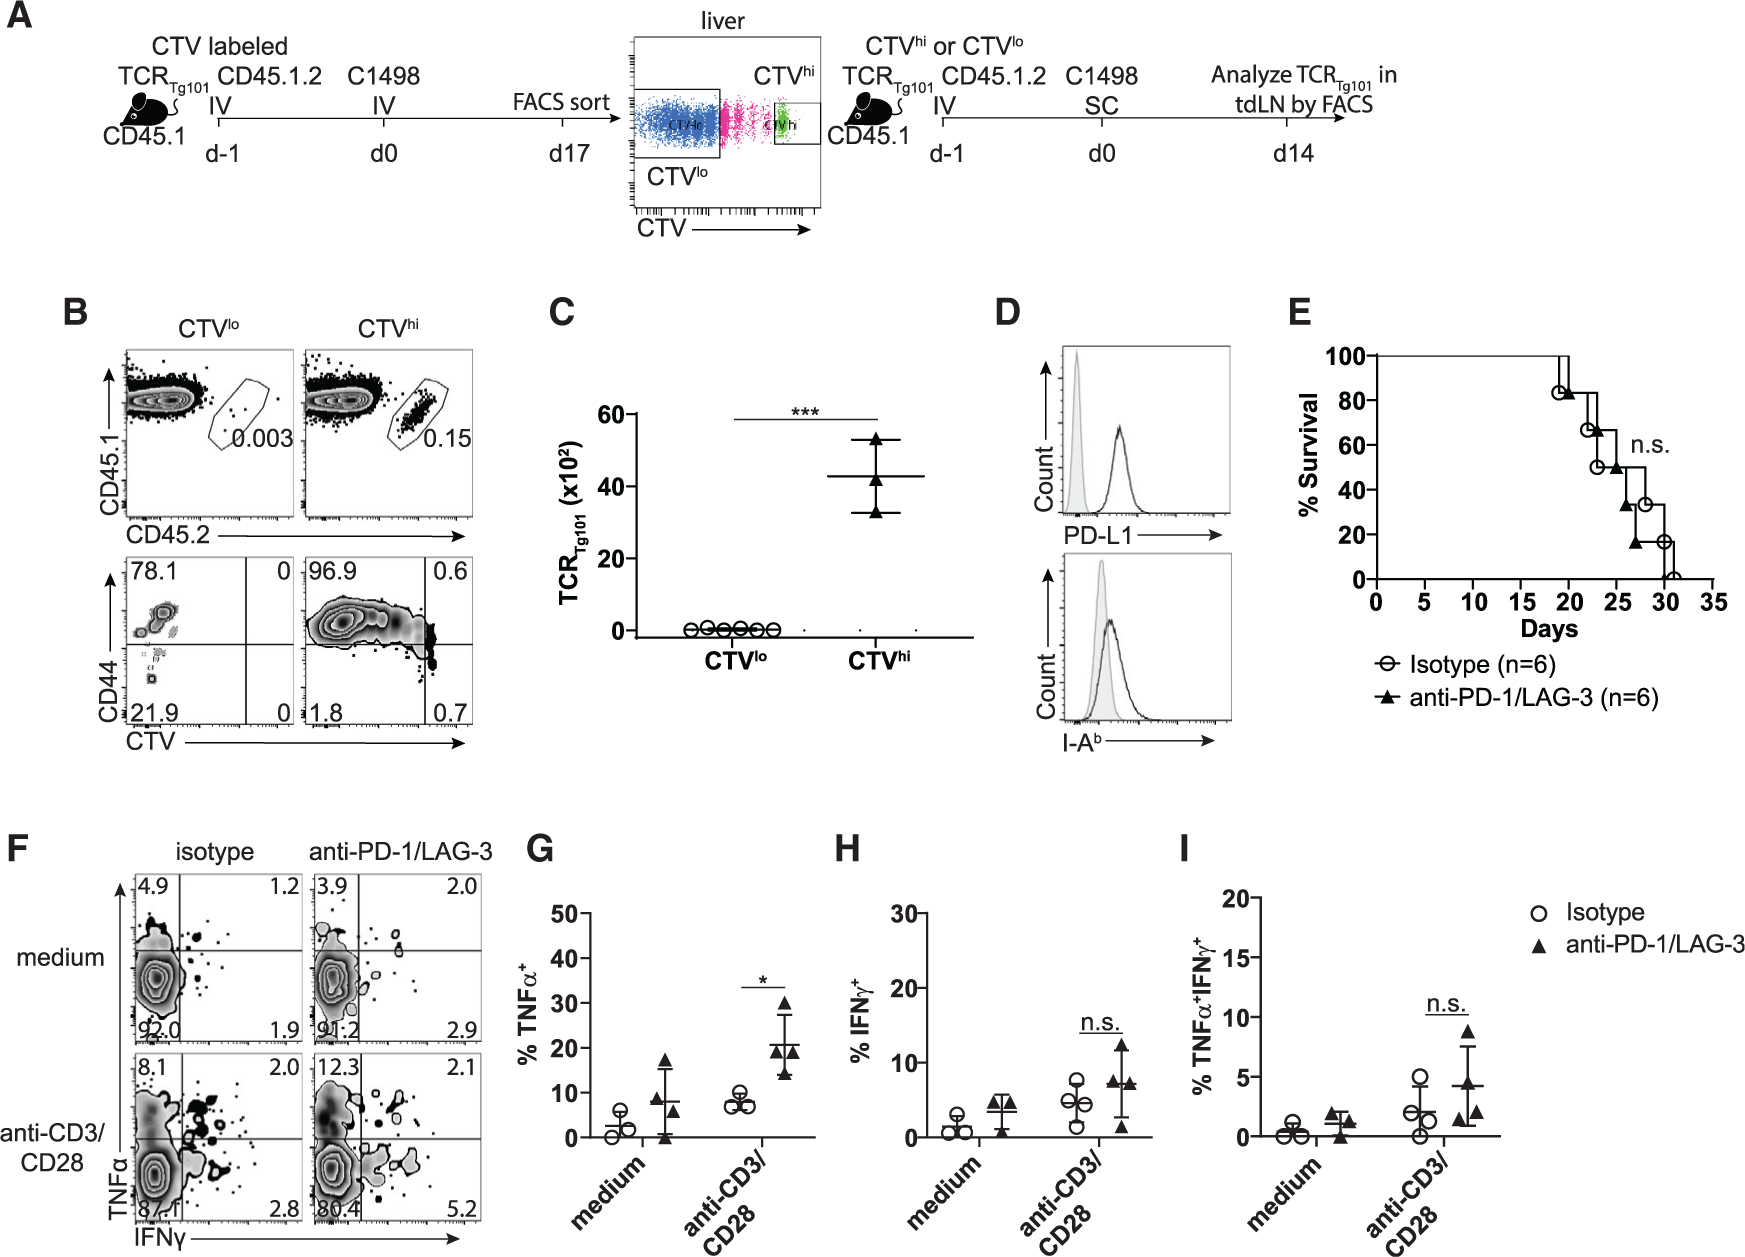
Figure 4. The exhausted TCRTg101 phenotype is profound.

(A) Experimental design: 8 × 10⁶ CTV-labeled TCRTg101 (CD45.1.2) were transferred into B6.SJL (CD45.1) mice followed by i.v. challenge with C1498 leukemia cells 1 day later. Naive (CTVhi) or exhausted (CTVlo) TCRTg101 were isolated from livers of day-17 leukemia-bearing mice by FACS and were separately transferred into secondary B6.SJL hosts. These B6.SJL mice received a s.c. C1498 cell (106) challenge the following day. On day 14, numbers and CD44 expression of TCRTg101 in tdLNs were analyzed by flow cytometry.
(B) Representative FACS plots showing CTV dilution and CD44 expression of TCRTg101 in tdLNs of secondary B6.SJL mice with s.c. C1498 tumors.
(C) Quantified data showing numbers of TCRTg101 in tdLNs of secondary B6.SJL mice with s.c. C1498 tumors.
(D) Expression of PD-L1 and I-Ab on C1498 cells when analyzed directly ex vivo. Shaded histograms represent staining with appropriate isotype control antibodies.
(E) TCRTg101 (8 × 10⁶) were adoptively transferred into C57BL/6 mice. 1 day later, mice were challenged i.v. with C1498 cells (106) and were treated with anti-PD-1 and anti-LAG-3 or isotype control antibodies. Survival was assessed.
(F–I) Cytokine production by TCRTg101 in leukemia-bearing mice treated with 4 doses of isotype control or anti-PD-1/anti-LAG-3 antibody therapy. Mononuclear cells isolated from livers on day 16 were restimulated ex vivo with anti-CD3 and anti-CD28 antibodies and cytokine production was assessed. Gating was performed on TCRβ+CD8+CD45.1.2 cells (TCRTg101).
(F) Representative FACS plots showing TNFα and IFNγ production by TCRTg101.
Quantitative data are shown in (G)–(I) as mean ± SD. Data are pooled from 2 independent experiments with 2 to 3 mice/group. *p < 0.05; ***p < 0.001; n.s., not significant.
