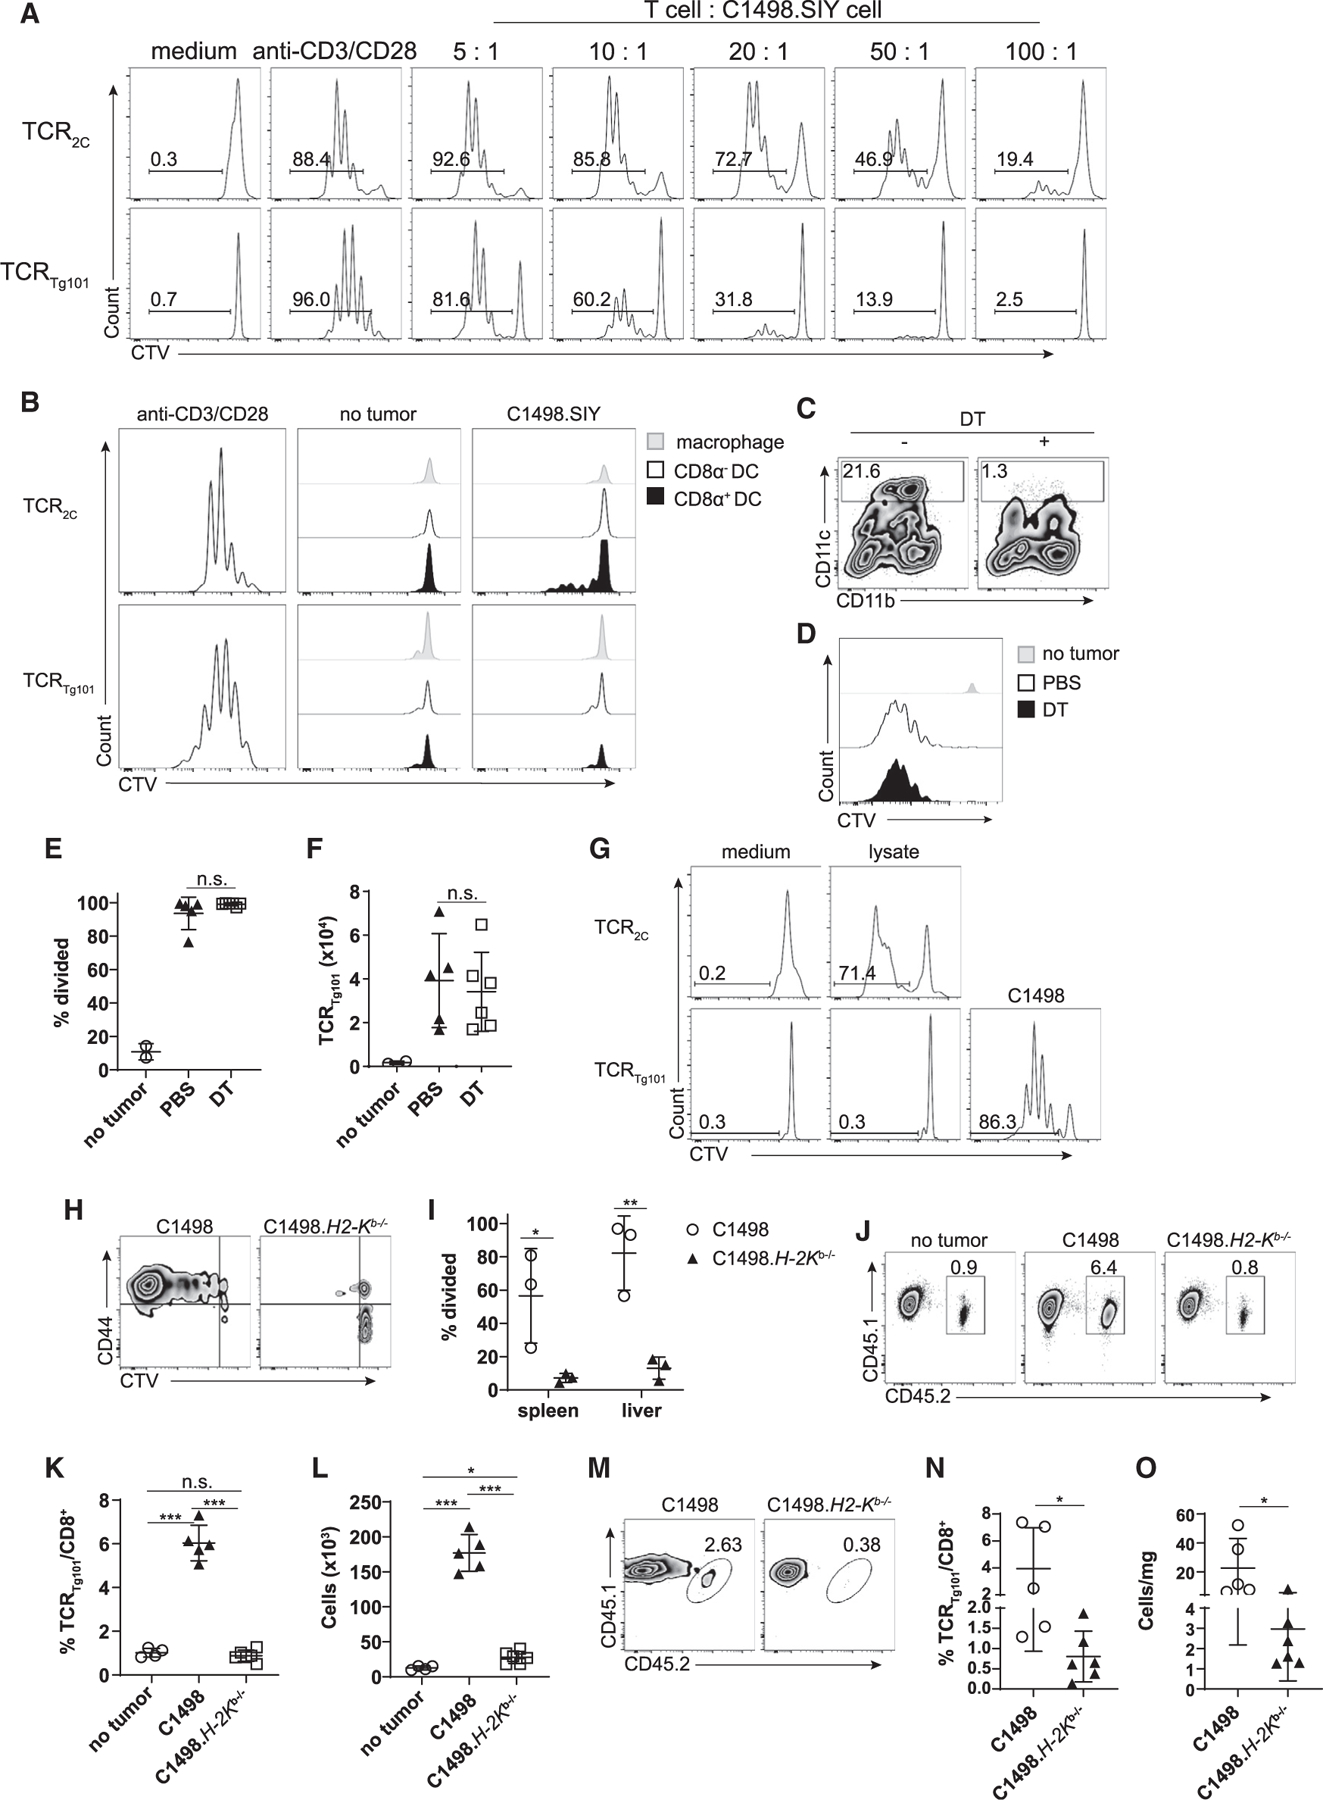
Figure 5. Direct antigen presentation by leukemia cells is required for in vivo antigen recognition by TCRTg101.

(A) TCR2C or TCRTg101 (1 × 10⁵) were CTV-labeled and cultured in vitro with C1498.SIY cells at various ratios for 72 h, at which point TCR2C and TCRTg101 proliferation, as measured by CTV dilution, was assessed by flow cytometry. TCR2C and TCRTg101 stimulated with anti-CD3 and anti-CD28 antibodies or left unstimulated served as positive and negative controls for proliferation, respectively.
(B) CTV dilution profiles of TCR2C or TCRTg101 cultured for 72 h with CD8α+ DCs, CD8 α− DCs, or macrophages isolated from spleens of naive C57BL/6 mice or C57BL/6 mice challenged 3 h earlier with C1498.SIY cells i.v.
(C–F) CTV-labeled TCRTg101 (CD45.1.2) were adoptively transferred into CD11c-DTR bone marrow chimeric mice (CD45.2) that received DT or PBS prior to and following i.v. C1498 cell challenge.
(C) Representative FACS plot showing frequencies of CD11c+ cells in spleens of CD11c-DTR bone marrow chimeras after DT or PBS treatment. Gating was performed on live CD3−CD19−CD11c+ cells.
(D) Representative FACS plots showing CTV dilution of TCRTg101 (TCRb+CD8+CD45.1.2 cells) in livers of naive or C1498 cell-challenged CD11c-DTR bone marrow chimeric mice (treated with DT or PBS) at day 12.
(E and F) Quantitative data from (D) are shown.
(G) CTV dilution profiles of TCR2C and TCRTg101 cultured with BMDCs pulsed with C1498.SIY or C1498 cell lysates, respectively. CTV dilution profile of TCRTg101 cultured with live C1498 cells was included as a positive control (lower right). Representative FACS plots are shown.
(H and I) 2 × 10⁶ CTV-labeled TCRTg101 (CD45.2) were transferred i.v. into B6.SJL (CD45.1) mice followed by an i.v. challenge with 106 C1498 or C1498.H2-Kb−/− cells the following day. On day 18, TCRTg101 proliferation was assessed.
(H) Representative FACS plots showing CTV dilution and CD44 expression on TCRTg101 in livers of mice previously challenged with C1498 or C1498.H2-Kb−/− cells.
(I) Quantitative data from (H) are shown.
(J–L) 2 × 10⁶ CTV-labeled TCRTg101 (CD45.1.2) were transferred i.v. into B6.SJL (CD45.1) mice followed by a s.c. challenge with 106 C1498 or C1498.H2-Kb−/− cells the following day. 14 days later, TCRTg101 frequencies and numbers were assessed in tdLNs and tumors.
(J) Representative FACS plots showing TCRTg101 frequencies in tdLNs of mice with s.c. C1498 or Kb−/− C1498 tumors.
(K and L) Quantitative data showing frequencies (K) and numbers (L) of TCRTg101 in tdLNs of mice with s.c C1498 or Kb−/− C1498 tumors.
(M) Representative FACS plots showing TCRTg101 frequencies among total CD8+ T cell populations in s.c. C1498 or Kb−/− C1498 tumors.
(N and O) Quantitative data showing TCRTg101 frequencies (N) and numbers/mg of tumor tissue (O).
Data are representative (I) of or pooled (E–F, K–L, and M–O) from 2 independent experiments with 3 mice/group and presented as mean ± SD. *p < 0.05; **p < 0.01; ***p < 0.001; n.s., not significant.
