Figure 5.
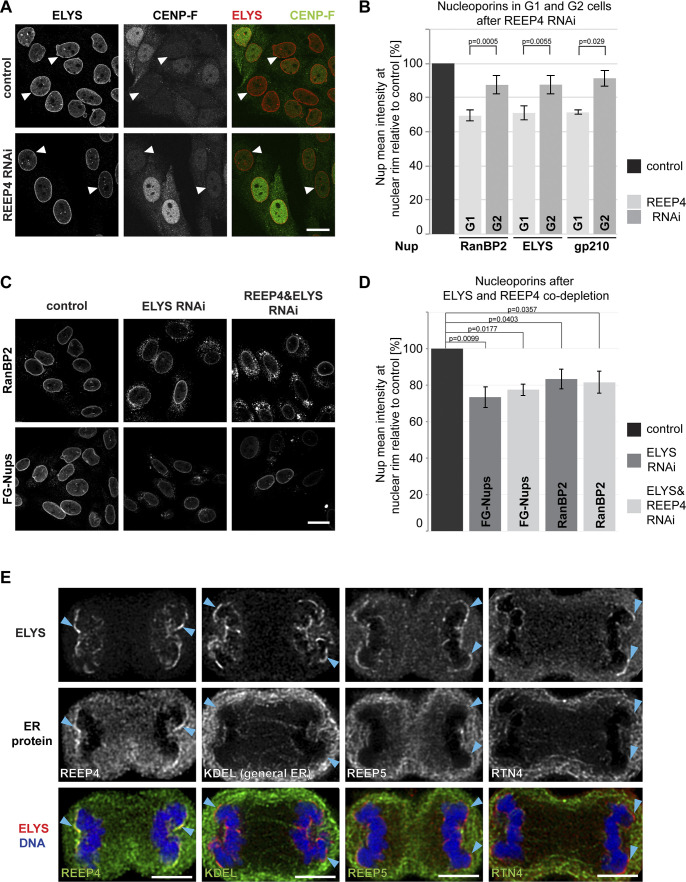
REEP4 promotes mitotic NPC formation. (A–C) HeLa cells treated with control siRNA or depleted of REEP4 (A and B) or ELYS and ELYS/REEP4 (C and D), immunolabeled for indicated nucleoporins and CENP-F (A and B), and imaged by confocal microscopy. (A and C) Representative images. (A) Arrowheads indicate cells with low CENP-F signal. (B and D) Mean intensities of the respective nucleoporins at the nuclear rim. (B) Mean intensities were measured in either G1 cells (low CENP-F) or G2 cells (high CENP-F signal). Nucleoporin levels shown are relative to the respective control (G1 or G2). ELYS, n = 8; RanBP2, n = 10; gp210, n = 4; ≥21 cells analyzed per G1 or G2 condition. (D) n = 4. At least 100 cells were analyzed per condition. See Fig. S3 F for analysis of ELYS and REEP4 depletion efficiency. (B and D) Error bars are SEM. Two-sided, paired t tests were performed on the raw data. (E) REEP4-HA cells in anaphase, immunolabeled for ELYS and the HA tag (to detect REEP4), KDEL (general ER), REEP5, or RTN4 (both markers of high curvature ER), and imaged by confocal microscopy. Arrowheads indicate chromosomal noncore regions with accumulated ELYS. Scale bars: 20 µm (A and C), 5 µm (E).

