Figure S2.
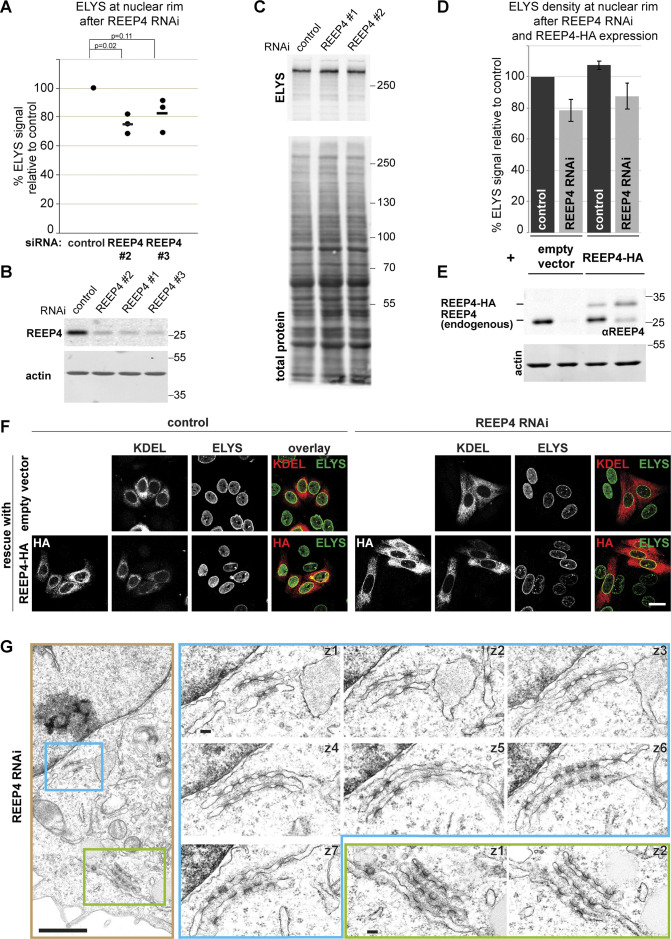
Characterization of the REEP4 depletion phenotype. Related to Fig. 4. (A) HeLa cells were transfected with control siRNA or REEP4 siRNAs #2 and #3 (REEP4 siRNA #1 is used in all other experiments), fixed, immunolabeled for ELYS, and imaged by confocal microscopy. Mean intensities at the nuclear rim were measured in control and REEP4 RNAi cells from the microscopy images. At least 100 cells were analyzed per condition; shown are the normalized mean intensities obtained in three experiments (dots). The horizontal line indicates the mean of the three experiments. Welch’s t test was performed on normalized data. For REEP4 siRNA #3, the P value is larger than 0.05; however, in each single experiment, ELYS levels are reduced compared with the control. We therefore conclude that ELYS reduction at the nuclear rim is a specific effect of REEP4 depletion. (B and C) Whole lysates of HeLa cells depleted of REEP4 using the indicated siRNAs were analyzed by SDS-PAGE and Western blotting and probed for REEP4 (B) or ELYS (C). To indicate amounts of loaded proteins, either actin (B) or total protein (C) was visualized. (D–F) Empty HA-tagging vector or RNAi-resistant, HA-tagged wild-type REEP4 was expressed in control cells or REEP4 RNAi cells, fixed, immunolabeled for ELYS, and imaged by confocal microscopy. (D) ELYS mean intensity at the nuclear rim was measured in transfected cells identified by expression of cotransfected RFP-KDEL (this transfection marker was used because the empty HA-tagging vector control does not yield an HA signal in transfected cells). Results of eight experiments are shown; ≥100 cells were analyzed per condition. Error bars are SEM. (E) Western blot analysis of lysates from cells used for experiment described in D. The lanes correspond to the bars of the graph directly above. Endogenous REEP4 and REEP4-HA were detected with anti-REEP4 antibody; actin served as a loading control. (F) Example images from experiment analyzed in E and D. In cells depleted of endogenous REEP4 and expressing REEP4-HA, ELYS levels at the nuclear rim are restored. However, in the entire population, REEP4-HA is not expressed to the same levels as endogenous REEP4 (see E) and only partially rescues the REEP4 RNAi phenotype (see D). Scale bar is 20 µm. (G) Additional example for transmission EM analysis of REEP4 RNAi phenotype as in Fig. 4, F and G. Left: Overview image. Right: Images of consecutive serial z-sections of the regions outlined in blue and green in the overview image. Scale bars: overview 1 µm, serial sections 100 nm.

