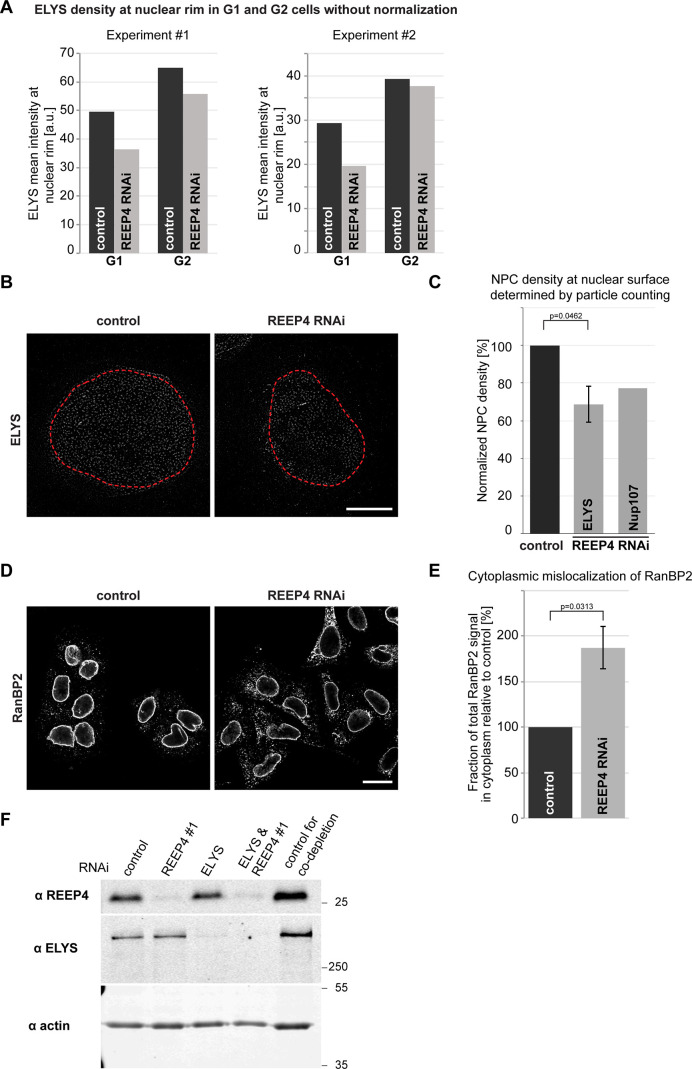
Figure S3.
Further characterization of the role of REEP4 in mitotic NPC assembly. Related to Fig. 5. (A) Two examples for ELYS signal mean intensity changes in G1 versus G2 after REEP4 RNAi. These are two of the eight experiments that were incorporated into Fig. 5 B but showing the raw data without normalization to the G1 or G2 controls. (B and C) Quantification of NPC numbers per surface area in control and REEP4-depleted HeLa cells in G1 cells (identified by low CENP-F signal) expressing endogenously GFP-tagged Nup107 (Otsuka et al., 2016) and immunostained for GFP or ELYS. (B) Representative images. Red outline marks mask generated for particle counting in the two nuclei. Scale bar is 5 µm. (C) NPC densities were determined by particle counting of ELYS- or Nup107-positive NPC-sized structures at the nuclear surface in control and REEP4-depleted cells and normalized to control conditions. At least eight cells were analyzed per condition in each experiment. ELYS: n = 4; error bars are SEM. A two-sided t test for unequal variance was performed on the normalized data. Nup107: average of two experiments with very similar outcomes is shown. (D and E) Quantification of the cytoplasmic pool of the nucleoporin RanBP2 in control and REEP4-depleted HeLa G1 cells. (D) Representative images. Scale bar is 20 µm. (E) Mean signal intensity of RanBP2 in the cytoplasm in REEP4 RNAi cells relative to control. At least 80 cells were analyzed per condition in each experiment. (C and E) Shown are the means from three experiments. Error bars are SEM. A one-sided, unequal variance t test was performed on normalized data. (F) Western blot analysis of REEP4 and ELYS depletion in experiments shown in Fig. 5, C and D. ELYS was depleted by ∼85% and REEP4 by ∼90% in both single- and double-depletion experiments (average of two experiments).

